September 03, 2025 a 09:03 am

PLD: Trend and Support & Resistance Analysis - Prologis, Inc.
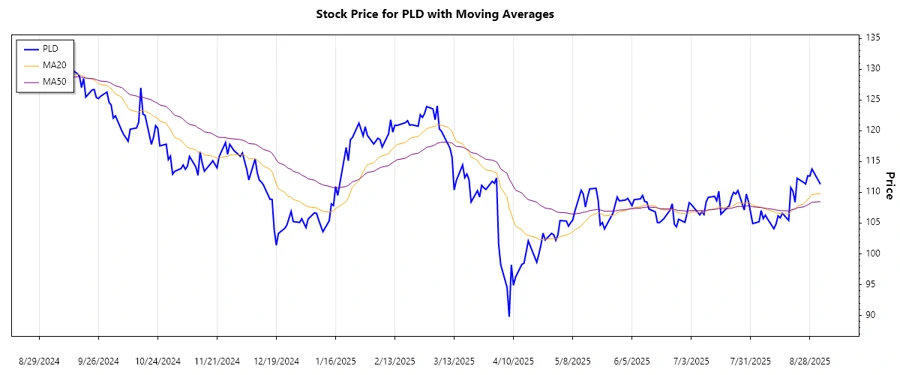
Prologis, Inc. operates as a leader in logistics real estate, focusing on key markets for growth. The recent data suggests a fluctuating trend with potential volatility in the coming months. Understanding the support and resistance levels will be essential for investors considering entry or exit points. The technical indicators such as EMA provide insights into the short-term direction of the stock price.
Trend Analysis
The following analysis is based on the Exponential Moving Averages (EMA) calculated over the recent course of trading days:
| Date | Close | Trend |
|---|---|---|
| 2025-09-02 | $111.3 | ⚖️ |
| 2025-08-29 | $113.78 | ▲ |
| 2025-08-28 | $112.64 | ▲ |
| 2025-08-27 | $112.68 | ▲ |
| 2025-08-26 | $111.35 | ▲ |
| 2025-08-25 | $111.62 | ▲ |
| 2025-08-22 | $112.28 | ▲ |
The current movement suggests a slight upwards trend as the EMA20 remains just about equal to EMA50. The stock is oscillating around a stable point after brief bullish movements.
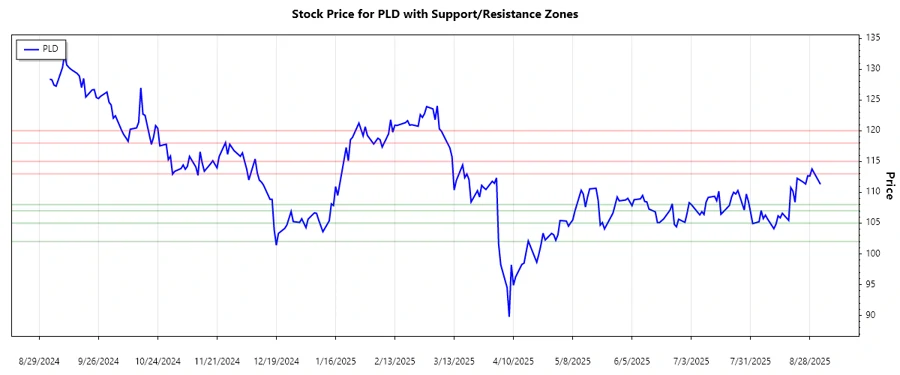
Support and Resistance
Key levels have been identified using significant price levels in the past:
| Zone Type | From | To |
|---|---|---|
| Resistance | $118 | $120 |
| Resistance | $113 | $115 |
| Support | $102 | $105 |
| Support | $107 | $108 |
The current price is testing resistance levels around $113 to $115. A break above this could signify a potential start to a more sustained uptrend.
Conclusion
The analysis of Prologis, Inc. stock suggests a near-term stabilization with critical resistance around $115. As a leader in logistics real estate, any economic disruption or change in trade patterns could impact the stock volatility. Investors should watch for breakout patterns above resistance levels as a sign of bullish strength. However, current consolidation indicates a potential sideways market.
Smart Data Insight
Master the Perfect Entry & Exit for this Stock
Don't leave your profits to chance. Historically, this stock follows specific seasonal patterns that institutional traders use to maximize returns.
- ✅ Identify the "Golden Buying Window"
- ✅ Avoid high-risk correction cycles
- ✅ Backtested data from the last 20+ years