January 23, 2026 a 10:16 am
PLD: Fibonacci Analysis - Prologis, Inc.
Prologis, Inc. (PLD) has shown a significant uptrend over the past months. As the global leader in logistics real estate, its focus on high-barrier, high-growth markets has positioned the company for sustained growth. The diverse customer base and substantial property investments support its stability. As market conditions evolve, the stock may continue to offer substantial opportunities for growth, with potential retracements providing key buying opportunities.
Fibonacci Analysis
| Trend Analysis | Details |
|---|---|
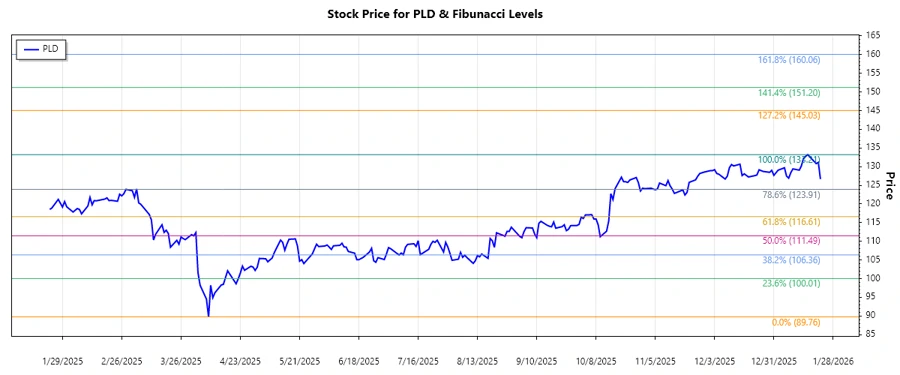
| Start Date | 2025-04-08 |
| End Date | 2026-01-22 |
| High Price | $133.21 (2026-01-16) |
| Low Price | $89.76 (2025-04-08) |
Fibonacci Levels
| Level | Price |
|---|---|
| 0.236 | $102.45 |
| 0.382 | $111.08 |
| 0.5 | $111.485 |
| 0.618 | $119.16 |
| 0.786 | $124.87 |
The current price of $126.67 is within the 0.786 retracement zone, indicating potential resistance at this level.
This could technically suggest a momentary pause or consolidation phase, with the price testing this level as a resistance.
Conclusion
The analysis of Prologis, Inc. (PLD) stock reflects a robust upward trend from a low of $89.76 to a high of $133.21. As global demand for logistics spaces increases, the company is well-positioned due to its strategic investments. However, the current Fibonacci retracement level suggests caution, as the price may face resistance. Nevertheless, should this level be overcome, it could provide a solid base for further gains. Analysts should remain vigilant of market trends and global logistics demands as key influencing factors.