September 13, 2025 a 06:44 am

PLD: Fibonacci Analysis - Prologis, Inc.
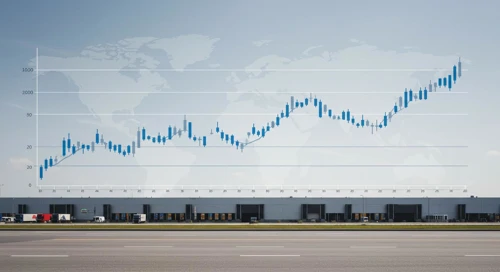
Prologis, Inc., a leading entity in logistics real estate, shows promising dynamics in high-growth markets. Analyzing the recent trend in their stock may provide insights into potential future movements, benefiting strategic investment decisions.
Fibonacci Analysis
| Parameter | Details | ||||||||||||
|---|---|---|---|---|---|---|---|---|---|---|---|---|---|
| Start Date | 2024-09-13 | ||||||||||||
| End Date | 2025-09-12 | ||||||||||||
| High Price (Date) | 129.98 (2024-09-13) | ||||||||||||
| Low Price (Date) | 89.76 (2025-04-08) | ||||||||||||
| Fibonacci Levels |
|
||||||||||||
| Current Price | 115.35 | ||||||||||||
| Retracement Zone | 0.786 | ||||||||||||
| Interpretation | The current price is in the 0.786 Fibonacci retracement level, indicating a potential resistance. |
Conclusion
With Prologis, Inc. in the upper echelon of its Fibonacci retracement levels, investors should be cautious of potential resistance at this point. The stock's position suggests the possibility of a correction unless the momentum continues to surpass this threshold. Analysts must consider macroeconomic factors influencing logistics and real estate demands, alongside the company’s efficient use of its high-barrier assets.
Smart Data Insight
Master the Perfect Entry & Exit for this Stock
Don't leave your profits to chance. Historically, this stock follows specific seasonal patterns that institutional traders use to maximize returns.
- ✅ Identify the "Golden Buying Window"
- ✅ Avoid high-risk correction cycles
- ✅ Backtested data from the last 20+ years