August 13, 2025 a 04:44 pm
PLD: Fibonacci Analysis - Prologis, Inc.
Prologis, Inc., a global leader in logistics real estate, has shown significant movements in its stock price during the recent months. The company's focus on high-growth markets has provided a resilient outlook for investors. An analysis of recent price patterns indicates the potential for strategic trading opportunities based on current and historical trends.
Fibonacci Analysis
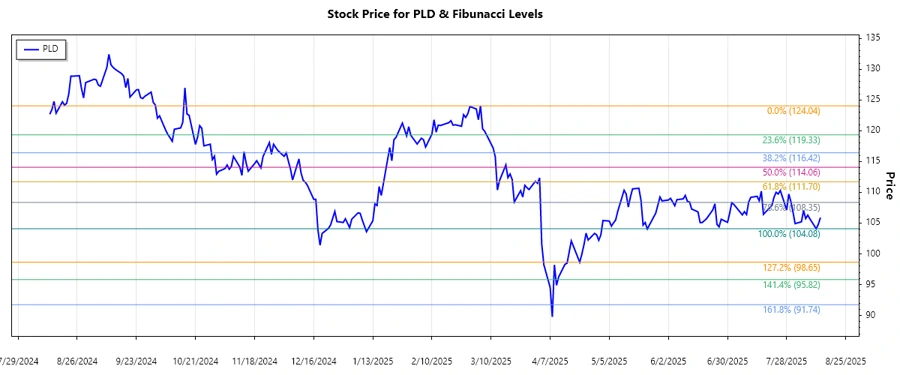
The technical analysis of Prologis (PLD) indicates a dominant downtrend, traced from March to August 2025. The Fibonacci retracement levels calculated for this trend provide potential zones for price action reversals.
| Metric | Value |
|---|---|
| Trend Start Date | 2025-03-05 |
| Trend End Date | 2025-08-13 |
| High Price | $124.04 (2025-03-05) |
| Low Price | $104.08 (2025-08-11) |
| Fibonacci 0.236 | $109.43 |
| Fibonacci 0.382 | $111.79 |
| Fibonacci 0.5 | $114.06 |
| Fibonacci 0.618 | $116.32 |
| Fibonacci 0.786 | $119.14 |
| Retracement Zone | None: Current price is $105.89, below all retracement levels. |
| Technical Interpretation | The failure to rise above the 0.236 level suggests weak bullish momentum. Breaking below recent lows may lead to further declines. |
Conclusion
Prologis, Inc. is at a critical point in its price movement, with a sustained downtrend posing risks for bullish investors. However, should reversal occur near the Fibonacci levels, it could signal an opportunity. Investors should watch for signs of support at lower price levels or potential breakthroughs if bullish sentiment returns. Given the company's leadership in logistics real estate, its long-term growth prospects remain positive, though short-term technical signals suggest vigilance.
Smart Data Insight
Master the Perfect Entry & Exit for this Stock
Don't leave your profits to chance. Historically, this stock follows specific seasonal patterns that institutional traders use to maximize returns.
- ✅ Identify the "Golden Buying Window"
- ✅ Avoid high-risk correction cycles
- ✅ Backtested data from the last 20+ years