
June 25, 2026 a 03:30 am

PLD: Dividend Analysis - Prologis, Inc.
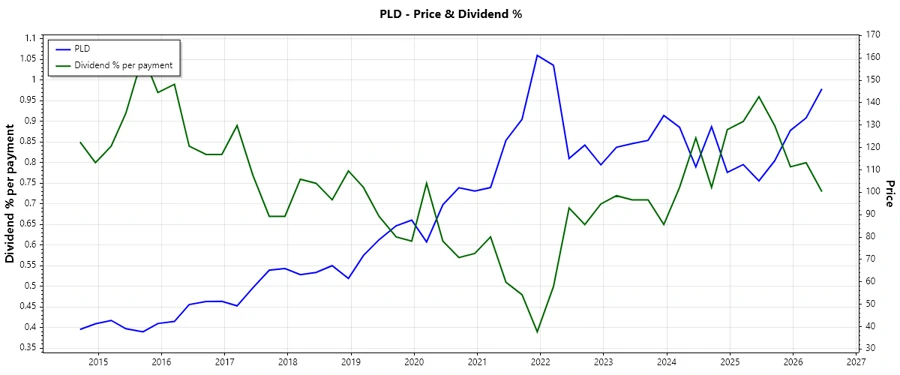
Prologis, Inc., a prominent name in the real estate investment sector, has a stable track record with dividends spanning three decades. With a current dividend yield of approximately 2.85%, stakeholders find moderate returns, aligning with a conservative dividend growth over the years. As a stalwart in its sector, Prologis offers a solid dividend profile despite fluctuations in market conditions.
📊 Overview
The financial overview of Prologis emphasizes its dependable dividend policies and strong market position within the real estate sector. Notably, it upholds a 30-year record of consecutive dividend payments, a testament to its commitment to returning value to shareholders.
| Attribute | Details |
|---|---|
| Sector | Real Estate |
| Dividend yield | 2.85 % |
| Current dividend per share | 4.01 USD |
| Dividend history | 30 years |
| Last cut or suspension | None |
🗣️ Dividend History
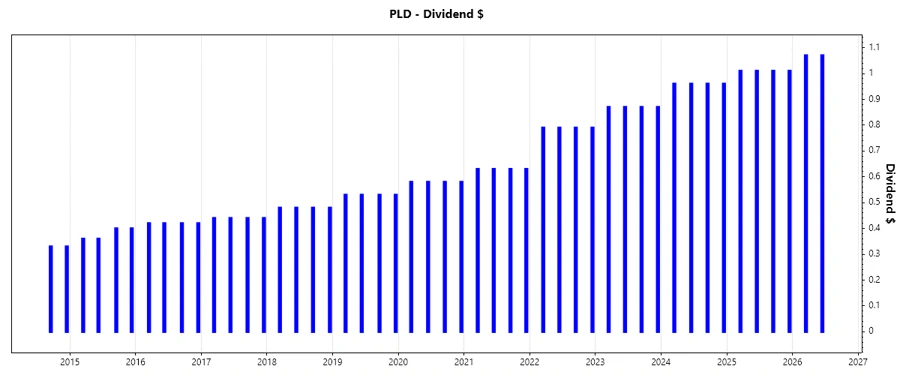
The historical data of Prologis' dividends reflects its consistent payment strategy which is critical for both current and prospective investors aiming for predictable income streams.
| Year | Dividend per Share (USD) |
|---|---|
| 2026 | 2.14 |
| 2025 | 4.04 |
| 2024 | 3.84 |
| 2023 | 3.48 |
| 2022 | 3.16 |
📈 Dividend Growth
A close examination of Prologis' dividend growth over the recent years highlights a consistent upward trend, contributing to its attractiveness for dividend-seeking investors.
| Time | Growth |
|---|---|
| 3 years | 8.53 % |
| 5 years | 11.73 % |
The average dividend growth is 11.73% over 5 years. This shows moderate but steady dividend growth.
⚠️ Payout Ratio
An analysis of Prologis' payout ratios reveals a cautious approach in dividend payments backed by its earnings and cash flow, ensuring long-term sustainability.
| Key figure | Ratio |
|---|---|
| EPS-based | 100.51 % |
| Free cash flow-based | 75.02 % |
Despite Prologis' elevated EPS payout ratio at 100.51%, the FCF coverage paints a more reassuring picture at 75.02%. This indicates a cautious yet sustainable payout strategy.
✅ Cashflow & Capital Efficiency
Prologis' cash flow metrics emphasize the company's ability to generate efficient returns and manage its capital expenditures, underscoring financial robustness.
| Metric | 2023 | 2024 | 2025 |
|---|---|---|---|
| Free Cash Flow Yield | 4.25% | 5.02% | 4.18% |
| Earnings Yield | 2.42% | 3.81% | 2.85% |
| CAPEX to Operating Cash Flow | 0% | 0% | 0% |
| Stock-based Compensation to Revenue | 3.34% | 2.83% | 2.11% |
| Free Cash Flow / Operating Cash Flow Ratio | 1 | 1 | 1 |
Through efficient capital allocation and strong cash flow yields, Prologis demonstrates robust capital efficiency ensuring a solid backbone for future growth.
📊 Balance Sheet & Leverage Analysis
The leverage metrics of Prologis offer insights into its capital structure, highlighting its moderate debt levels and capacity to manage financial obligations effectively.
| Metric | 2023 | 2024 | 2025 |
|---|---|---|---|
| Debt-to-Equity | 55.65% | 58.38% | 65.87% |
| Debt-to-Assets | 31.82% | 33.04% | 35.49% |
| Debt-to-Capital | 35.76% | 36.86% | 39.71% |
| Net Debt to EBITDA | 4.43 | 4.01 | 4.71 |
| Current Ratio | 0.55 | 0.92 | 0.23 |
| Quick Ratio | 0.55 | 0.92 | 0.23 |
| Financial Leverage | 1.75 | 1.77 | 1.86 |
Prologis maintains a balanced leverage position, supporting its ability to navigate financial landscapes efficiently while operating with stability.
📈 Fundamental Strength & Profitability
Prologis stands strong in terms of profitability metrics, reflecting efficient operations and a dedication to maintaining a competitive edge in its market.
| Metric | 2023 | 2024 | 2025 |
|---|---|---|---|
| Return on Equity | 5.75% | 6.92% | 6.41% |
| Return on Assets | 3.29% | 3.91% | 3.45% |
| Margins: Net | 38.13% | 45.50% | 38.80% |
| Margins: EBIT | 50.89% | 60.38% | 52.02% |
| Margins: EBITDA | 81.86% | 91.84% | 81.90% |
| Margins: Gross | 74.94% | 74.92% | 59.60% |
| Research & Development to Revenue | 0% | 0% | 0% |
Profitability metrics reveal a resilient operational framework of Prologis, supporting steady returns and a robust market standing.
📊 Price Development
🔍 Dividend Scoring System
| Criterion | Score | Rating Bar |
|---|---|---|
| Dividend yield | 3 | |
| Dividend Stability | 5 | |
| Dividend growth | 4 | |
| Payout ratio | 4 | |
| Financial stability | 4 | |
| Dividend continuity | 5 | |
| Cashflow Coverage | 4 | |
| Balance Sheet Quality | 4 |
Total Score: 33/40
🗳️ Rating
In conclusion, Prologis, Inc. demonstrates a compelling dividend strategy characterized by consistency and growth. While the payout ratios warrant attention, the overall financial health and dividend continuity render this stock as a reliable option for dividend-focused portfolios, earning a strong recommendation for those seeking steady income with moderate growth potential.
Smart Data Insight
Master the Perfect Entry & Exit for this Stock
Don't leave your profits to chance. Historically, this stock follows specific seasonal patterns that institutional traders use to maximize returns.
- ✅ Identify the "Golden Buying Window"
- ✅ Avoid high-risk correction cycles
- ✅ Backtested data from the last 20+ years