May 18, 2026 a 03:31 pm

PLD: Dividend Analysis - Prologis, Inc.
Prologis, Inc. stands as a robust entity in the world of dividend stocks. With a dividend history spanning decades, this Real Estate Investment Trust (REIT) continues to offer its shareholders a commendable yield. The steady increase in dividends, coupled with a strong sectoral performance in logistics real estate, makes it an attractive choice for income-seeking investors. Additionally, its strategic global positioning further enhances its appeal in a competitive market.
📊 Overview
Prologis, Inc. is well-positioned within the Real Estate sector, with a strong dividend profile offering a yield of 2.93%. With a consistent dividend increment over 30 years and no recent cuts, it signifies resilient shareholder returns.
| Metric | Detail |
|---|---|
| Sector | Real Estate |
| Dividend Yield | 2.93% |
| Current Dividend Per Share | 4.01 USD |
| Dividend History | 30 years |
| Last Cut or Suspension | None |
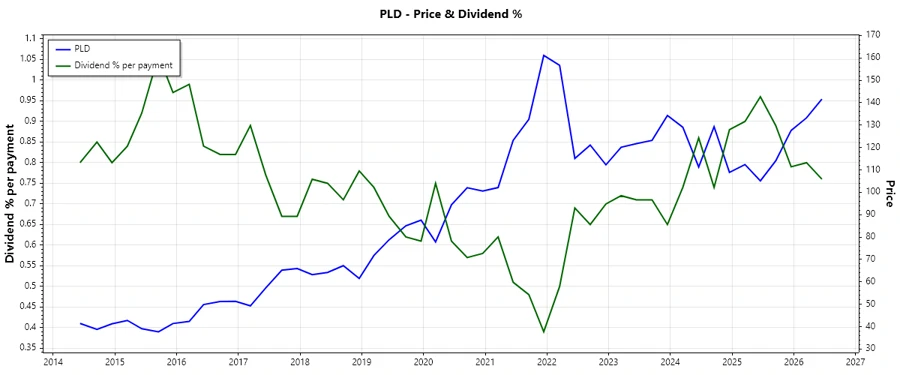
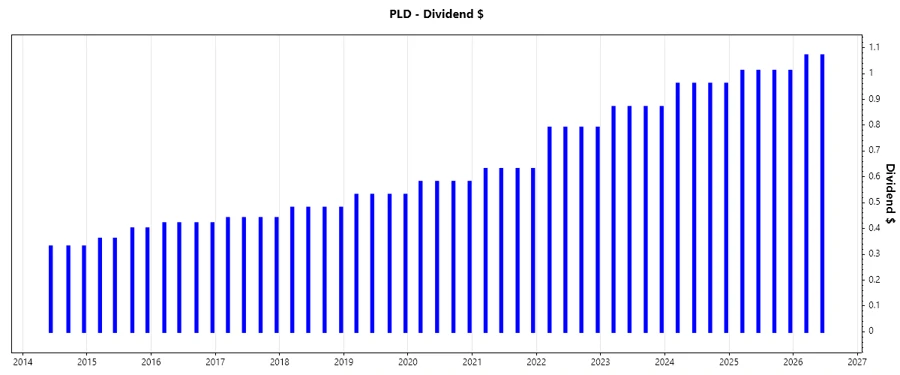
🗣️ Dividend History
Understanding the consistency and growth of dividend payments is crucial, as it highlights the reliability and financial health of Prologis, Inc. in rewarding its shareholders.
| Year | Dividend Per Share |
|---|---|
| 2026 | 2.14 |
| 2025 | 4.04 |
| 2024 | 3.84 |
| 2023 | 3.48 |
| 2022 | 3.16 |
📈 Dividend Growth
Analyzing the dividend growth provides insight into Prologis' ability to increase shareholder value over time, reflecting financial stability and effective management.
| Time | Growth |
|---|---|
| 3 years | 8.53% |
| 5 years | 11.73% |
The average dividend growth is 11.73% over 5 years. This shows moderate but steady dividend growth, enhancing investor confidence.
📉 Payout Ratio
Examining the payout ratio is vital to ensure the sustainability of dividend payments without compromising the company's growth potential.
| Key Figure | Ratio |
|---|---|
| EPS-based | 100.51% |
| Free Cash Flow-based | 75.02% |
The payout ratio is crucial to assessing dividend sustainability. With an EPS-based ratio of 100.51% and a FCF-based ratio of 75.02%, Prologis ensures its payouts do not undermine capital investment objectives.
✅ Cashflow & Capital Efficiency
The evaluation of cash flow and capital efficiency metrics is an essential aspect to determine the operational health and investment effectiveness of Prologis.
| Indicator | 2025 | 2024 | 2023 |
|---|---|---|---|
| Free Cash Flow Yield | 4.18% | 5.02% | 4.25% |
| Earnings Yield | 2.85% | 3.81% | 2.42% |
| CAPEX to Operating Cash Flow | |||
| Stock-based Compensation to Revenue | 2.11% | 2.83% | 3.34% |
| Free Cash Flow / Operating Cash Flow Ratio | 1 | 1 | 1 |
| Return on Invested Capital | 3.60% | 4.56% | 3.84% |
The consistent return on invested capital and stable cash flow ratios indicate Prologis' effective management and strong financial backbone, providing assurance of its capital efficiency.
⚠️ Balance Sheet & Leverage Analysis
A rigorous evaluation of the balance sheet and leverage provides insights into the company's financial stability, risk, and capacity to weather economic downturns.
| Indicator | 2025 | 2024 | 2023 |
|---|---|---|---|
| Debt-to-Equity | 0.66 | 0.58 | 0.56 |
| Debt-to-Assets | 0.35 | 0.33 | 0.32 |
| Debt-to-Capital | 0.40 | 0.37 | 0.36 |
| Net Debt to EBITDA | 4.71 | 4.01 | 4.43 |
| Current Ratio | 0 | 0.92 | 0.55 |
| Quick Ratio | 0.23 | 0.92 | 0.55 |
| Financial Leverage | 1.86 | 1.77 | 1.75 |
The leverage ratios suggest prudent management of debt levels and financial resilience. However, enhancing liquidity levels, particularly the current ratio, could further bolster its operational flexibility.
🔍 Fundamental Strength & Profitability
Assessing fundamental strength and profitability provides a clear image of operational efficiency and return potential for shareholders in Prologis, Inc.
| Indicator | 2025 | 2024 | 2023 |
|---|---|---|---|
| Return on Equity | 6.41% | 6.92% | 5.75% |
| Return on Assets | 3.45% | 3.91% | 3.29% |
| Margins: Net | 38.80% | 45.50% | 38.13% |
| Margins: EBIT | 52.02% | 60.39% | 50.89% |
| Margins: EBITDA | 81.90% | 91.84% | 81.86% |
| Margins: Gross | 53.98% | 74.92% | 74.94% |
| Research & Development to Revenue | 0% | 0% | 0% |
The profitability metrics underscore robust margin performance and competent asset utilization. Still, the absence of R&D investment suggests a focus more on operational efficiency rather than innovation.
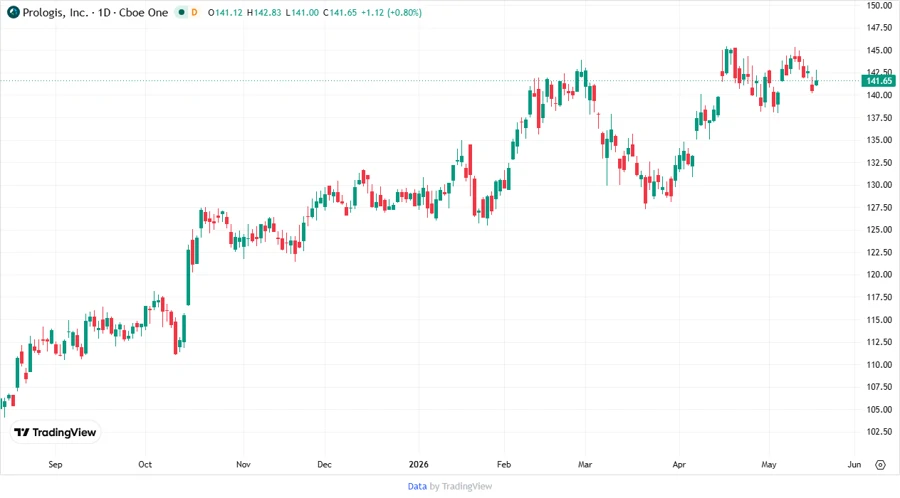
📈 Price Development
🏆 Dividend Scoring System
| Criteria | Score | Graphical Representation |
|---|---|---|
| Dividend Yield | 4 | |
| Dividend Stability | 5 | |
| Dividend Growth | 3 | |
| Payout Ratio | 3 | |
| Financial Stability | 4 | |
| Dividend Continuity | 5 | |
| Cashflow Coverage | 4 | |
| Balance Sheet Quality | 4 |
Overall Score: 32/40
🔍 Rating
Prologis, Inc. delivers a compelling dividend profile backed by substantial growth history and balance sheet integrity. While the immediate payout ratios warrant careful monitoring, the company remains an attractive investment for income seekers who value stability and moderate growth potential in the real estate sector.
Smart Data Insight
Master the Perfect Entry & Exit for this Stock
Don't leave your profits to chance. Historically, this stock follows specific seasonal patterns that institutional traders use to maximize returns.
- ✅ Identify the "Golden Buying Window"
- ✅ Avoid high-risk correction cycles
- ✅ Backtested data from the last 20+ years