
May 06, 2026 a 02:46 am

PLD: Dividend Analysis - Prologis, Inc.
Prologis, Inc. is a leading real estate investment trust with a focus on the logistics sector. Their strong dividend history and attractive yield make them a desirable choice for income-focused investors. With over 30 years of steady dividend payments, the company has shown resilience and commitment to returning value to shareholders. As market conditions fluctuate, their dividend growth strategy reflects a balance of stability and moderate growth, providing investors with both assurance and opportunity.
Overview 📊
| Key Metric | Details |
|---|---|
| Sector | Real Estate |
| Dividend Yield | 2.97 % |
| Current Dividend per Share | 4.01 USD |
| Dividend History | 30 years |
| Last Cut or Suspension | None |
Dividend History 📜
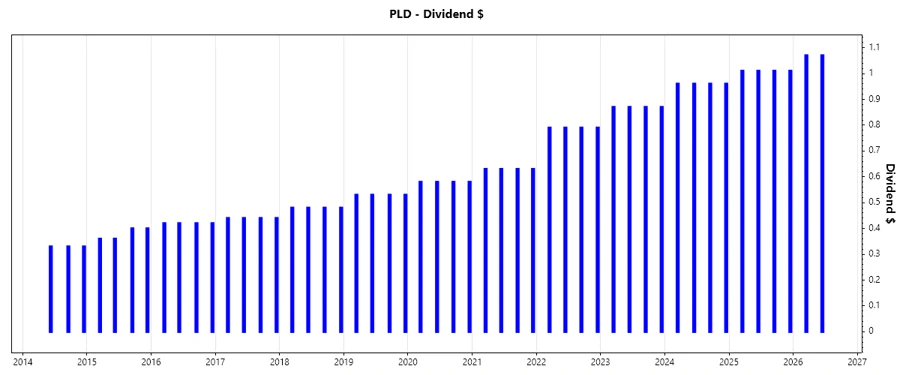
A robust dividend history is a testament to a company's financial health and commitment to shareholders. Prologis, Inc. boasts a 30-year record, showcasing resilience even during economic downturns. Investors value such a history for the predictability and assurance it provides in long-term income planning.
| Year | Dividend per Share (USD) |
|---|---|
| 2026 | 2.14 |
| 2025 | 4.04 |
| 2024 | 3.84 |
| 2023 | 3.48 |
| 2022 | 3.16 |
Dividend Growth 📈
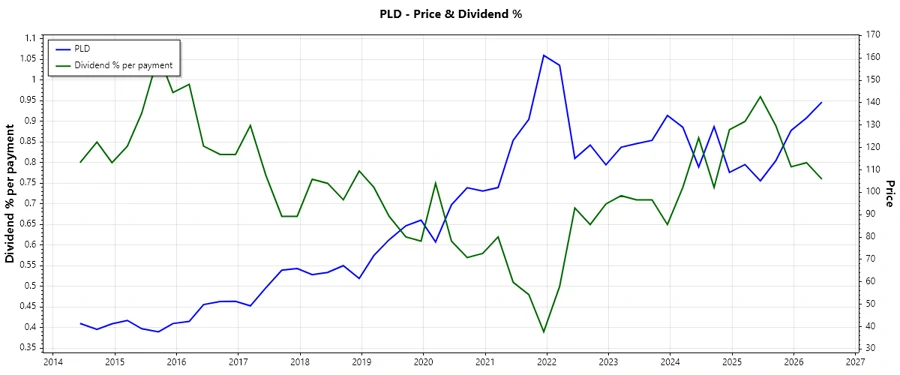
Dividend growth is a critical metric for evaluating the potential increase in income over time. Prologis has managed to display substantial dividend growth over the past years, indicative of their financial health and strategic capability to enhance shareholder value.
| Time | Growth |
|---|---|
| 3 years | 8.53 % |
| 5 years | 11.73 % |
The average dividend growth is 11.73 % over 5 years. This shows moderate but steady dividend growth, appealing to investors seeking sustainable income growth.
Payout Ratio 📉
The payout ratio gauges a company's ability to sustain dividend payments from its profits. Prologis exhibits a moderately high EPS-based payout ratio of 100.51 % and a more conservative FCF-based ratio of 75.01 %. High ratios can sometimes signal potential dividend pressure, although context like industry standards and growth plans should be considered.
| Key Figure | Ratio |
|---|---|
| EPS-based | 100.51 % |
| Free Cash Flow-based | 75.01 % |
Cashflow & Capital Efficiency💸
Analyzing cash flow and capital efficiency helps assess the sustainability of dividends and potential for reinvestment. Stable cash flows and efficient capital allocation indicate a company’s financial robustness and ability to support dividends and growth initiatives.
| Metric | 2023 | 2024 | 2025 |
|---|---|---|---|
| Free Cash Flow Yield | 4.25% | 5.02% | 4.18% |
| Earnings Yield | 2.42% | 3.81% | 2.85% |
| CAPEX to Operating Cash Flow | N/A | N/A | N/A |
| Stock-based Compensation to Revenue | 3.34% | 2.83% | 2.11% |
| Free Cash Flow / Operating Cash Flow Ratio | 100% | 100% | 100% |
Balance Sheet & Leverage Analysis 💼
Understanding a company’s leverage and liquidity is crucial for assessing financial risk and dividend sustainability. Prologis' leverage metrics indicate a balanced use of debt, supporting their growth strategies while maintaining manageable financial risk.
| Metric | 2023 | 2024 | 2025 |
|---|---|---|---|
| Debt-to-Equity | 0.56 | 0.58 | 0.66 |
| Debt-to-Assets | 0.32 | 0.33 | 0.35 |
| Debt-to-Capital | 0.36 | 0.37 | 0.40 |
| Net Debt to EBITDA | 4.43 | 4.01 | 4.71 |
| Current Ratio | 0.55 | 0.92 | 0.23 |
| Quick Ratio | 0.55 | 0.92 | 0.23 |
| Financial Leverage | 1.75 | 1.77 | 1.86 |
Fundamental Strength & Profitability 💪
Assessing profitability and fundamental strengths provides insight into operational efficiency and potential for sustainable growth. Prologis demonstrates solid profitability margins, indicative of their strong market position and effective cost management.
| Metric | 2023 | 2024 | 2025 |
|---|---|---|---|
| Return on Equity | 5.75% | 6.92% | 6.41% |
| Return on Assets | 3.29% | 3.91% | 3.45% |
| Margins: Net | 38.13% | 45.50% | 38.80% |
| EBIT | 50.89% | 60.38% | 52.02% |
| EBITDA | 81.86% | 91.84% | 81.90% |
| Gross | 74.94% | 74.92% | 59.60% |
| Research & Development to Revenue | 0% | 0% | 0% |
Price Development 💹
Dividend Scoring System 🏆
| Category | Score (1-5) | Score Bar |
|---|---|---|
| Dividend Yield | 3 | |
| Dividend Stability | 5 | |
| Dividend Growth | 4 | |
| Payout Ratio | 2 | |
| Financial Stability | 4 | |
| Dividend Continuity | 5 | |
| Cashflow Coverage | 4 | |
| Balance Sheet Quality | 4 |
Total Score: 31/40
Rating ☑️
Prologis, Inc. stands out as a strong dividend-payer with a stable and consistent dividend history. The ability to sustain dividends through economic turbulence, coupled with moderate growth makes it a reliable choice for dividend-oriented portfolios. Investors should appreciate the company's robust financial structure, while considering the high payout ratio as a potential consideration for future growth prospects.
Smart Data Insight
Master the Perfect Entry & Exit for this Stock
Don't leave your profits to chance. Historically, this stock follows specific seasonal patterns that institutional traders use to maximize returns.
- ✅ Identify the "Golden Buying Window"
- ✅ Avoid high-risk correction cycles
- ✅ Backtested data from the last 20+ years