February 15, 2026 a 02:46 am


PLD: Dividend Analysis - Prologis, Inc.
Prologis, Inc. presents a robust dividend profile with a notable history of consistent payments. The company's strategic positioning within the real estate sector contributes to a reliable income-generating capability, underscored by its substantial dividend yield of 2.95%. This analysis explores the dividend performance, growth potential, and overall financial standing of Prologis, Inc.
📊 Overview
Prologis, Inc. operates within the Real Estate sector, offering a competitive dividend yield. This yield reflects the company's ability to generate consistent shareholder returns through its strategic investments in real estate assets.
| Key Metrics | Details |
|---|---|
| Sector | Real Estate |
| Dividend Yield | 2.95% |
| Current Dividend per Share | $4.01 USD |
| Dividend History | 30 years |
| Last Cut or Suspension | None |
🗣️ Dividend History
The historical consistency in dividend payments over the last 30 years signifies Prologis' commitment to rewarding its shareholders. Understanding the history is crucial for evaluating the sustainability and reliability of its payments.
| Year | Dividend per Share (USD) |
|---|---|
| 2026 | 1.07 |
| 2025 | 4.04 |
| 2024 | 3.84 |
| 2023 | 3.48 |
| 2022 | 3.16 |
📈 Dividend Growth
The growth of dividends is an indicator of a company's potential to increase shareholder value over time. Prologis has shown a commendable growth rate in dividends over the past years.
| Time | Growth |
|---|---|
| 3 years | 8.53% |
| 5 years | 11.73% |
The average dividend growth is 11.73% over 5 years. This shows moderate but steady dividend growth.
✅ Payout Ratio
The payout ratio is critical in understanding how much of the company's earnings are being returned to shareholders as dividends.
| Key Figure | Ratio |
|---|---|
| EPS-based | 110.38% |
| Free Cash Flow-based | 75.46% |
The payout ratio based on EPS is 110.38%, which indicates Prologis is paying more in dividends than its current earnings. However, with a more sustainable FCF-based ratio of 75.46%, the company shows it manages its cash flow well to support its dividends.
⚠️ Cashflow & Capital Efficiency
Evaluating cash flow and capital efficiency provides insights into how effectively Prologis converts revenues into cash and reinvests it for future growth.
| Metric | 2025 | 2024 | 2023 |
|---|---|---|---|
| Free Cash Flow Yield | 4.18% | 5.02% | 4.25% |
| Earnings Yield | 2.85% | 3.81% | 2.42% |
| CAPEX to Operating Cash Flow | 0% | 0% | 0% |
| Stock-based Compensation to Revenue | 2.11% | 2.83% | 3.33% |
| Free Cash Flow / Operating Cash Flow Ratio | 1 | 1 | 1 |
The metrics show a strong cash flow coverage with prudent capital management, indicating stable cash flows that underpin the company's capacity to maintain its dividend payments and reinvest in growth opportunities.
📉 Balance Sheet & Leverage Analysis
A thorough analysis of the balance sheet and leverage ratios is essential for assessing Prologis' financial health and its ability to meet financial obligations.
| Metric | 2025 | 2024 | 2023 |
|---|---|---|---|
| Debt-to-Equity | 0.659 | 0.584 | 0.557 |
| Debt-to-Assets | 0.355 | 0.330 | 0.318 |
| Debt-to-Capital | 0.397 | 0.369 | 0.358 |
| Net Debt to EBITDA | 4.71 | 4.01 | 4.43 |
| Current Ratio | 0.227 | 0.917 | 0.546 |
| Quick Ratio | 0.227 | 0.917 | 0.546 |
| Financial Leverage | 1.856 | 1.767 | 1.749 |
Prologis maintains a balanced approach to leveraging, with improving debt ratios, indicating strength in managing debt relative to its assets and equity. The favorable leverage positions imply a stable financial footing and reduced default risk.
✅ Fundamental Strength & Profitability
Understanding fundamental strength and profitability ratios helps in assessing the operational efficiency and profitability of Prologis.
| Metric | 2025 | 2024 | 2023 |
|---|---|---|---|
| Return on Equity | 6.41% | 6.92% | 5.75% |
| Return on Assets | 3.45% | 3.91% | 3.29% |
| Gross Margin | 59.60% | 74.92% | 74.94% |
| EBIT Margin | 52.02% | 60.38% | 50.89% |
| EBITDA Margin | 81.90% | 91.84% | 81.86% |
| Net Margin | 38.80% | 45.50% | 38.13% |
| R&D to Revenue | 0% | 0% | 0% |
The profitability metrics including ROE and ROA showcase Prologis' successful operational strategies, enhancing shareholder value through effective asset utilization. Strong margins further indicate robust operational efficiencies.
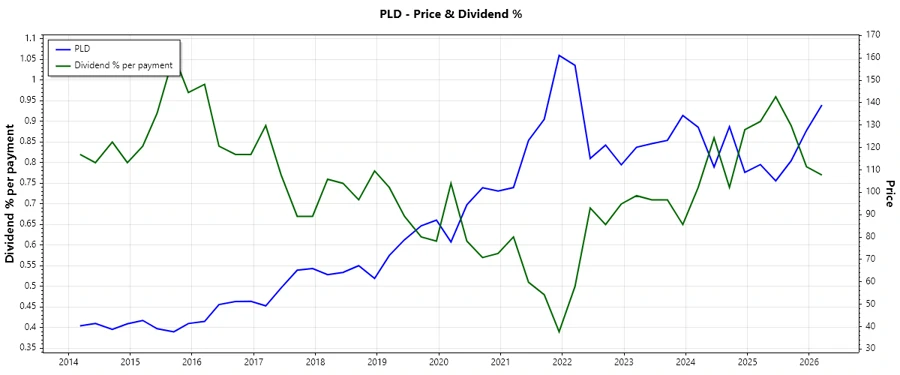
🔍 Price Development
📈 Dividend Scoring System
| Aspect | Score | Visual |
|---|---|---|
| Dividend Yield | 4 | |
| Dividend Stability | 5 | |
| Dividend Growth | 4 | |
| Payout Ratio | 3 | |
| Financial Stability | 4 | |
| Dividend Continuity | 5 | |
| Cashflow Coverage | 4 | |
| Balance Sheet Quality | 4 |
Overall Score: 33/40
🔎 Rating
Prologis, Inc. exhibits strong dividend payout policies and reliable growth metrics, suggestive of a solid investment for dividend-centric portfolios. Its financial health, coupled with robust cash flow management, supports the likelihood of sustained dividend payments, making it an attractive prospect for income-focused investors.
Smart Data Insight
Master the Perfect Entry & Exit for this Stock
Don't leave your profits to chance. Historically, this stock follows specific seasonal patterns that institutional traders use to maximize returns.
- ✅ Identify the "Golden Buying Window"
- ✅ Avoid high-risk correction cycles
- ✅ Backtested data from the last 20+ years