January 06, 2026 a 11:31 am

PLD: Dividend Analysis - Prologis, Inc.
Prologis, Inc. presents a substantial dividend profile characterized by a robust 29-year history of consistent dividend payments. This makes Prologis an attractive option for income-seeking investors, especially those focused on long-term stability and moderate potential for growth. With a current yield of approximately 3.17%, it fits well within the parameters of balanced income portfolios.
📊 Overview
Prologis operates within the real estate sector, offering a compelling dividend yield of 3.17% with a current dividend per share of $3.86. Notably, it boasts a 29-year streak in dividend history, illustrating resilience with its last dividend suspension back in 2009.
| Attribute | Details |
|---|---|
| Sector | Real Estate |
| Dividend Yield | 3.17% |
| Current Dividend per Share | $3.86 |
| Dividend History | 29 years |
| Last Cut or Suspension | 2009 |
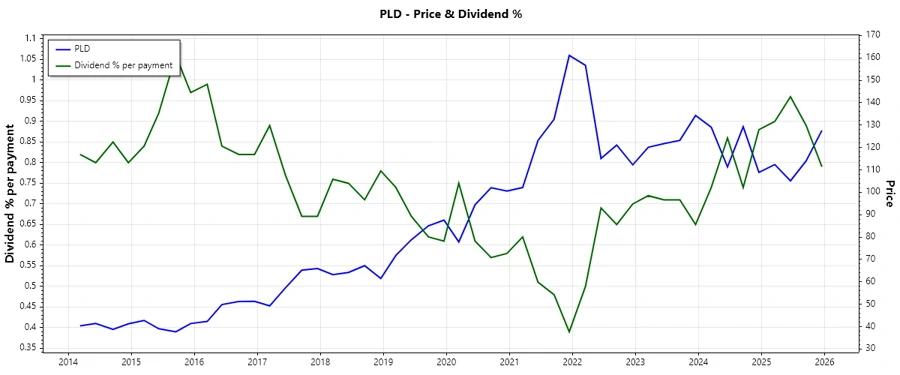
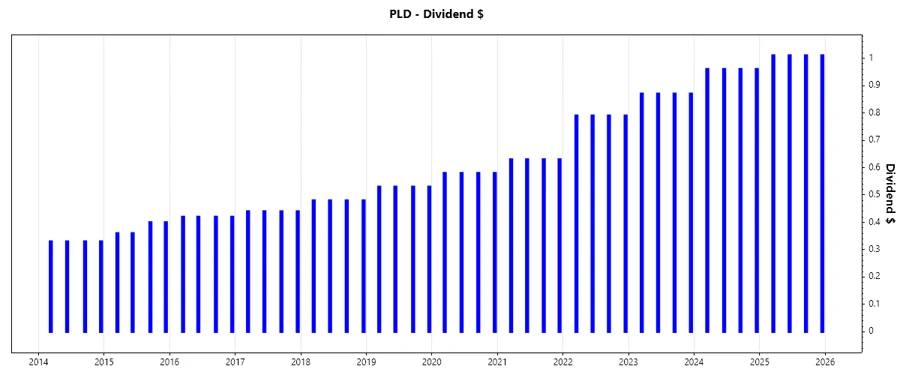
📈 Dividend History
Prologis' dividend history highlights its commitment to return value to shareholders. This metric is critical for gauging long-term financial health and investor returns.
| Year | Dividend per Share (USD) |
|---|---|
| 2025 | 4.04 |
| 2024 | 3.84 |
| 2023 | 3.48 |
| 2022 | 3.16 |
| 2021 | 2.52 |
✅ Dividend Growth
The dividend growth metrics provide insights into the company's capability to increase shareholder returns over time, which is crucial for sustaining investor interest and confidence.
| Time | Growth |
|---|---|
| 3 years | 8.53% |
| 5 years | 11.73% |
The average dividend growth is 11.73% over 5 years. This shows moderate but steady dividend growth, indicating strong financial discipline and a focus on shareholder returns.
🔍 Payout Ratio
Payout ratios are pivotal in assessing the sustainability of dividend payments. EPS and FCF ratios indicate the proportion of earnings paid out as dividends, affecting long-term financial planning.
| Key figure | Ratio |
|---|---|
| EPS-based | 111.65% |
| Free cash flow-based | 68.97% |
The EPS payout ratio above 100% raises caution concerning dividend sustainability, whereas the FCF payout ratio demonstrates a feasible coverage of dividends from free cash flow.
📈 Cashflow & Capital Efficiency
Monitoring cash flows and capital efficiency provides a comprehensive understanding of operational profitability and investment returns. Prologis exhibits sustained performance in these areas, driving shareholder value.
| Year | 2024 | 2023 | 2022 |
|---|---|---|---|
| Free Cash Flow Yield | 5.02% | 4.25% | 3.92% |
| Earnings Yield | 3.81% | 2.42% | 3.69% |
| CAPEX to Operating Cash Flow | 0% | 0% | 13.34% |
| Stock-based Compensation to Revenue | 2.83% | 3.34% | 2.94% |
| Free Cash Flow / Operating Cash Flow Ratio | 100% | 100% | 86.66% |
Despite fluctuations, Prologis demonstrates strong operational efficiency and resource allocation, underpinning potential for sustained dividend payments and financial growth.
📉 Balance Sheet & Leverage Analysis
Prologis' leverage metrics reflect its ability to manage debt and sustain operations independently of external financial pressures. Healthy figures suggest financial resilience.
| Year | 2024 | 2023 | 2022 |
|---|---|---|---|
| Debt-to-Equity | 58.38% | 55.65% | 46.05% |
| Debt-to-Assets | 33.04% | 31.82% | 27.89% |
| Debt-to-Capital | 36.86% | 35.76% | 31.53% |
| Net Debt to EBITDA | 4.01 | 4.43 | 4.18 |
| Current Ratio | 91.70% | 54.57% | 45.60% |
| Quick Ratio | 91.70% | 54.57% | 45.60% |
| Financial Leverage | 176.69% | 174.91% | 165.11% |
Stable leverage ratios and an improving quick ratio signify sound liquidity and effective debt strategy, enhancing investment appeal.
🔍 Fundamental Strength & Profitability
Analyzing profitability and fundamental strength paints a picture of Prologis' operational success, affecting shareholder returns and future investments.
| Year | 2024 | 2023 | 2022 |
|---|---|---|---|
| Return on Equity | 6.92% | 5.75% | 6.32% |
| Return on Assets | 3.91% | 3.29% | 3.83% |
| Net Profit Margin | 45.50% | 38.13% | 56.33% |
| EBIT Margin | 60.38% | 50.89% | 66.67% |
| EBITDA Margin | 91.84% | 81.86% | 97.02% |
| Gross Margin | 74.92% | 74.94% | 74.74% |
| Research & Development to Revenue | 0% | 0% | 0% |
Sustained profitability ratios indicate robust operating performance, promising potential returns for investors.
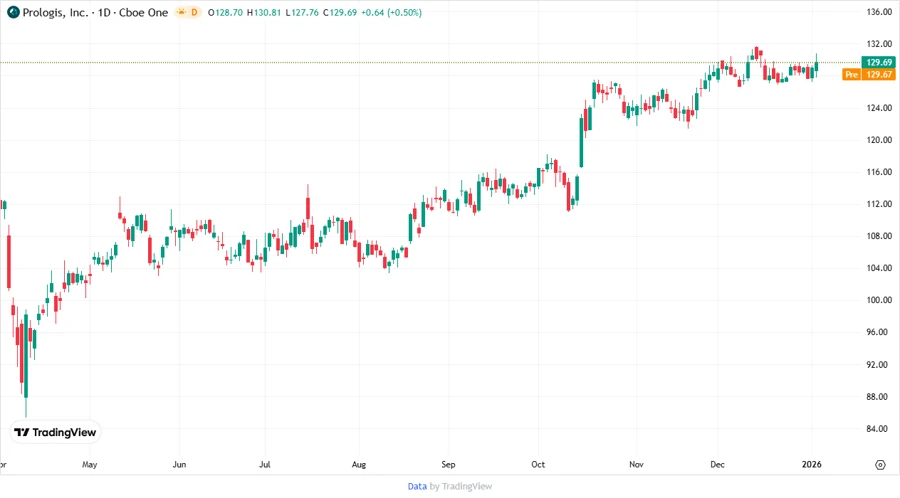
📈 Price Development
🗣️ Dividend Scoring System
| Criterion | Description | Score |
|---|---|---|
| Dividend yield | Current yield compared to industry peers | 3.25/5 |
| Dividend Stability | Consistency and reliability of dividend payments | 4/5 |
| Dividend growth | Growth of dividends over time | 3.75/5 |
| Payout ratio | Sustainability of dividend payments | 2.75/5 |
| Financial stability | Balance sheet and debt management | 3.5/5 |
| Dividend continuity | Continuous dividend payments without cuts | 4.25/5 |
| Cashflow Coverage | Ability of cash flows to cover dividends | 3/5 |
| Balance Sheet Quality | Strength and resilience of the balance sheet | 3.75/5 |
Total Score: 28/40
🔍 Rating
Prologis, Inc. exhibits a solid dividend profile with a focus on consistent growth and cash flow sustainability. While the payout ratio could limit future growth, their financial stability and history of strong returns suggest a credible long-term investment. Diversified investors seeking consistent income with moderate risk should consider including Prologis in their portfolios.