November 03, 2025 a 03:31 am
PLD: Dividend Analysis - Prologis, Inc.
Prologis, Inc. showcases a robust dividend history with a yield of approximately 3.5% and a decade-spanning stable performance. With an extensive history of 29 years without dividend cuts, this company projects a sound commitment to shareholders. However, its high EPS-based payout ratio indicates potential risk to dividend sustainability if earnings do not keep pace.
📊 Overview
Prologis operates within the real estate sector, offering a substantive dividend yield of 3.50%. With a current dividend of $3.86 per share and an impressive 29-year dividend history free from cuts or suspensions, the firm presents itself as a reliable dividend payer.
| Factor | Details |
|---|---|
| Sector | Real Estate |
| Dividend Yield | 3.50% |
| Current Dividend per Share | $3.86 USD |
| Dividend History | 29 years |
| Last Cut or Suspension | None |
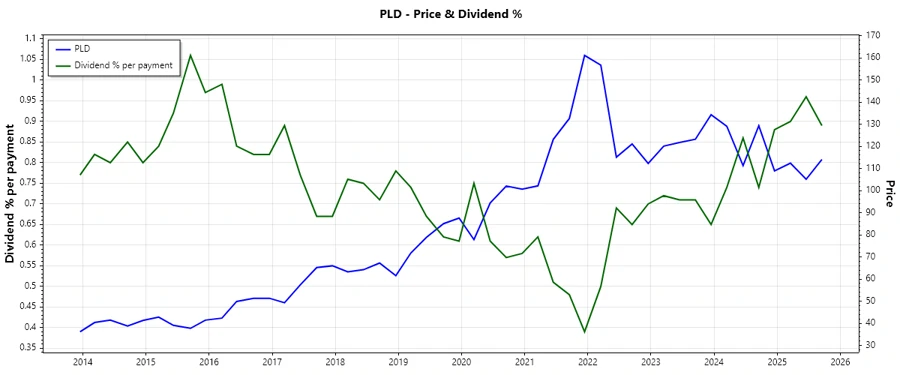
🗣️ Dividend History
The extensive dividend payment history over 29 years underscores Prologis’s commitment to returning value to shareholders. A consistent dividend payment narrative strengthens investor confidence, rendering the stock attractive for dividend-focused portfolios.
Description: Visual representation of historical dividend payouts for Prologis, Inc.
| Year | Dividend Per Share (USD) |
|---|---|
| 2025 | $3.03 |
| 2024 | $3.84 |
| 2023 | $3.48 |
| 2022 | $3.16 |
| 2021 | $2.52 |
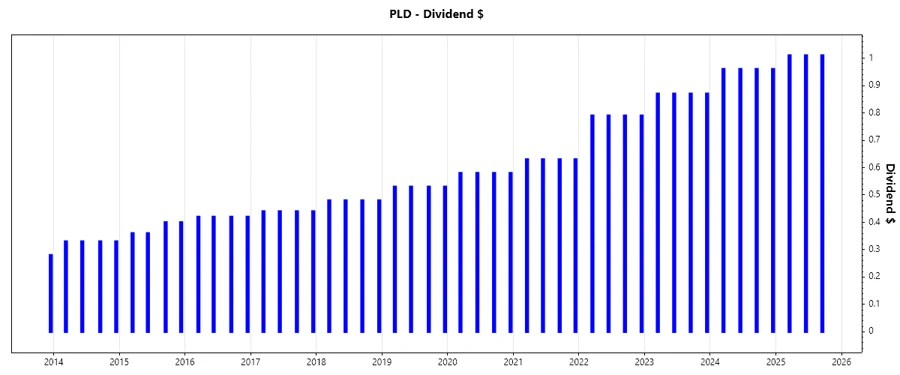
📈 Dividend Growth
Evaluating the dividend growth helps ascertain the firm's potential to augment its payouts over time. Prologis has sustained a reasonable growth in dividends over the past periods, indicating potential for future increases.
| Time Period | Growth |
|---|---|
| 3 years | 15.07% |
| 5 years | 12.62% |
The average dividend growth is 12.62% over 5 years. This shows moderate but steady dividend growth.
Description: Analysis of Prologis, Inc.'s dividend growth over 3 and 5 years.
📉 Payout Ratio
The payout ratio indicates the proportion of earnings a company pays out as dividends to shareholders. A high ratio could suggest a risky dividend sustainability if earnings do not align with the payouts.
| Key Figure | Ratio |
|---|---|
| EPS-based Payout Ratio | 111.65% |
| Free Cash Flow-based Payout Ratio | 69.14% |
With an EPS payout ratio of 111.65%, Prologis shows a potential sustainability risk in maintaining its dividends purely from earnings, despite a more moderate cash flow-based ratio.
✅ Cashflow & Capital Efficiency
These metrics are crucial for assessing the ability of Prologis to generate cash and efficiently utilize capital. A high free cash flow yield, combined with sustainable capital efficiency, provides a stable foundation for dividend payments and reinvestments.
| Year | 2024 | 2023 | 2022 |
|---|---|---|---|
| Free Cash Flow Yield | 5.02% | 4.25% | 3.92% |
| Earnings Yield | 3.81% | 2.42% | 3.69% |
| CAPEX to Operating Cash Flow | 0% | 0% | 13.34% |
| Stock-based Compensation to Revenue | 2.83% | 3.34% | 2.94% |
| FCF / Operating Cash Flow Ratio | 1 | 1 | 0.87 |
Prologis exhibits stable cash flow generation and effective capital allocation, indicative of potential for sustained dividend payouts and capital growth.
🗣️ Balance Sheet & Leverage Analysis
The balance sheet's leverage metrics delve into Prologis's financial stability and debt management capabilities, essential for long-term financial health and dividend security.
| Year | 2024 | 2023 | 2022 |
|---|---|---|---|
| Debt-to-Equity | 0.58 | 0.56 | 0.46 |
| Debt-to-Assets | 0.33 | 0.32 | 0.28 |
| Debt-to-Capital | 0.37 | 0.36 | 0.32 |
| Net Debt to EBITDA | 4.01 | 4.43 | 4.18 |
| Current Ratio | 0.92 | 0.55 | 0.46 |
| Quick Ratio | 0.92 | 0.55 | 0.46 |
| Financial Leverage | 1.77 | 1.75 | 1.65 |
Prologis manages its leverage efficiently with a stable debt structure and sufficient liquidity, contributing to its financial resilience and dividend reliability.
✅ Fundamental Strength & Profitability
Analyzing profitability and fundamental performance metrics reveals Prologis’s operational efficiency and market competitiveness, crucial for evaluating potential dividends and reinvestment strategies.
| Year | 2024 | 2023 | 2022 |
|---|---|---|---|
| Return on Equity (ROE) | 6.92% | 5.75% | 6.32% |
| Return on Assets (ROA) | 3.91% | 3.29% | 3.83% |
| Net Profit Margin | 45.50% | 38.13% | 56.33% |
| EBIT Margin | 60.38% | 50.89% | 66.67% |
| EBITDA Margin | 91.84% | 81.86% | 97.02% |
| Gross Margin | 74.92% | 74.94% | 74.74% |
| Research & Development to Revenue | 0% | 0% | 0% |
The firm demonstrates robust profitability metrics, with high margins and strong returns on equity and assets, underpinning its strategic positioning and dividend growth potential.
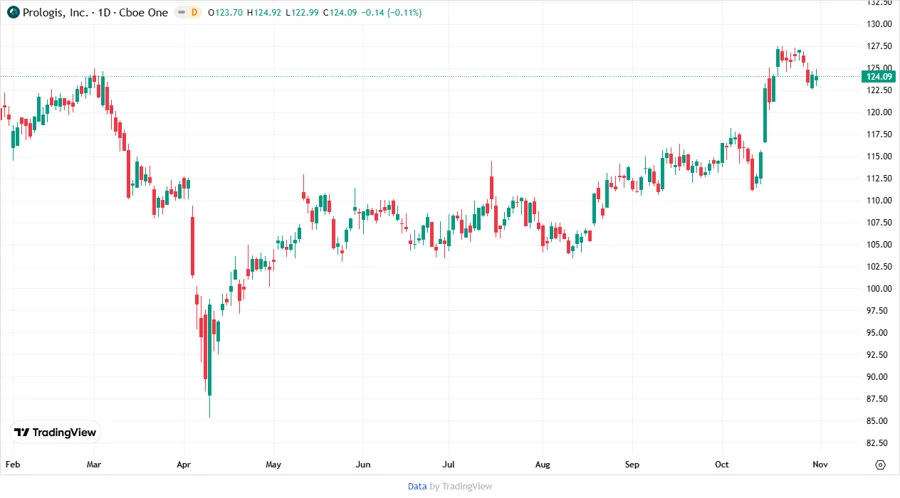
📈 Price Development
Description: Prologis, Inc.'s historical price movements and trend analysis.
✅ Dividend Scoring System
Prologis’s dividend metrics are evaluated based on diverse criteria, reflecting its capacity to sustain and develop dividend payouts.
| Criteria | Points | Score |
|---|---|---|
| Dividend Yield | 4 | |
| Dividend Stability | 5 | |
| Dividend Growth | 3 | |
| Payout Ratio | 2 | |
| Financial Stability | 4 | |
| Dividend Continuity | 5 | |
| Cashflow Coverage | 4 | |
| Balance Sheet Quality | 4 |
Total Score: 31/40
Rating
Prologis, Inc. presents a compelling investment opportunity based on its stable dividend history and solid financial fundamentals. Despite concerns over its EPS-based payout ratio, the company's strategic management of cash flow and debt positions it as a resilient player in the real estate sector. Investors should consider these factors alongside overall market conditions and individual investment goals.
Smart Data Insight
Master the Perfect Entry & Exit for this Stock
Don't leave your profits to chance. Historically, this stock follows specific seasonal patterns that institutional traders use to maximize returns.
- ✅ Identify the "Golden Buying Window"
- ✅ Avoid high-risk correction cycles
- ✅ Backtested data from the last 20+ years