UDR: Analysts Ratings - UDR Inc

UDR: Comprehensive breakdown of current and historical analyst ratings, offering insights into how expert sentiment has evolved over time.
July 20, 2026 a 12:38 pm
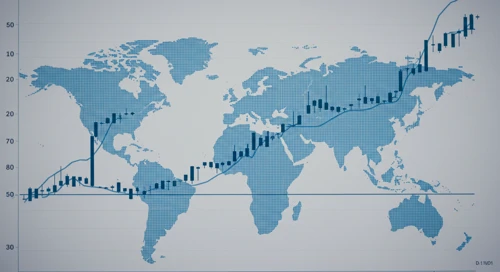
America Comparison. 20 Jul

Comparison of America. Where is strength and weakness? What has developed well and badly?
July 20, 2026 a 12:31 pm
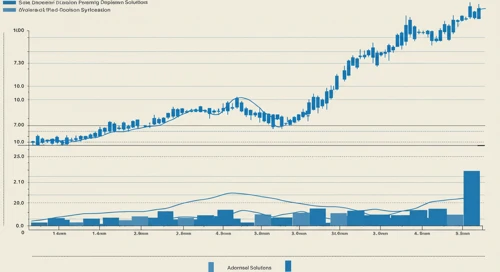
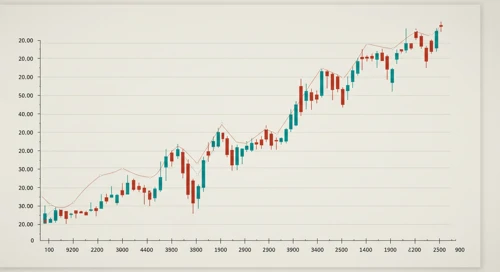
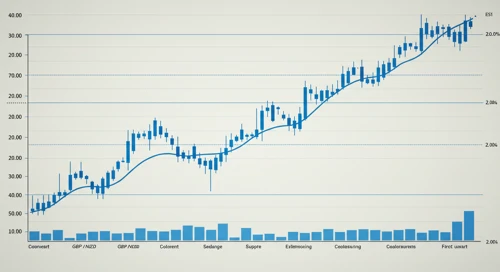
TFC: Fibunacci Level Technical Analysis - Truist Financial Corporation
TFC: Fibonacci retracement levels to identify key potential support and resistance zones, based on recent price trends.
July 20, 2026 a 11:44 am
RL: Fundamental Ratio Analysis - Ralph Lauren Corporation

RL: Evaluation of key financial ratios, analyst ratings, and price targets. A data-driven perspective on the valuation and market expectations.
July 20, 2026 a 11:43 am
GLW: Dividend Analysis - Corning Inc
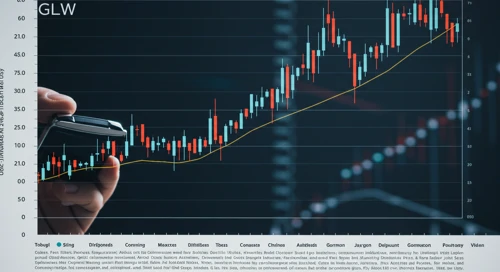
GLW: In-depth analysis of a company's dividend stability and key fundamental ratios to assess its financial strength and long-term investment potential.
July 20, 2026 a 11:31 am
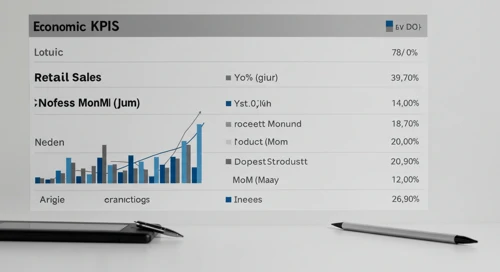
Todays Important Key Figures 20 Jul
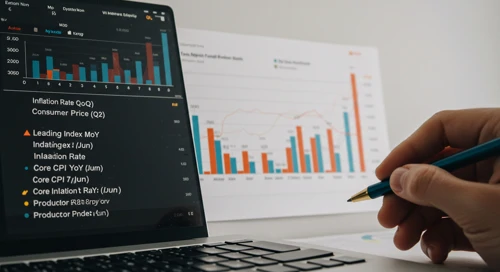
Today’s important economic data releases – a snapshot of key indicators influencing markets and shaping financial expectations.
July 20, 2026 a 11:00 am
EL: Fibunacci Level Technical Analysis - The Estée Lauder Companies Inc
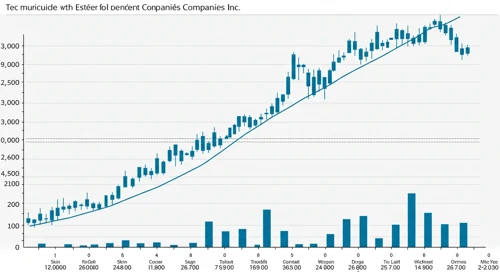
EL: Fibonacci retracement levels to identify key potential support and resistance zones, based on recent price trends.
July 20, 2026 a 10:15 am
NDSN: Trend with Support and Resistance Levels - Nordson Corporation
July 20, 2026 a 02:03 pm

J: Fundamental Ratio Analysis - Jacobs Solutions Inc
July 20, 2026 a 01:00 pm
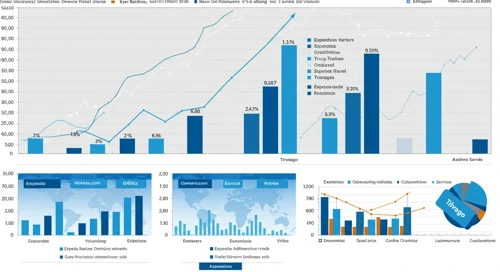
EXPE: Analysts Ratings - Expedia Group Inc
July 20, 2026 a 01:00 pm

PH: Dividend Analysis - Parker Hannifin Corporation
July 20, 2026 a 12:46 pm
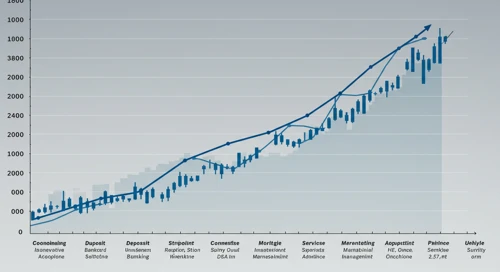
Materials Comparison. 20 Jul
Comparison of Materials. Where is strength and weakness? What has developed well and badly?
July 20, 2026 a 09:16 am
MNST: Analysts Ratings - Monster Beverage Corporation
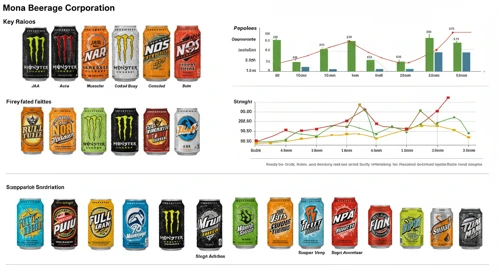
MNST: Comprehensive breakdown of current and historical analyst ratings, offering insights into how expert sentiment has evolved over time.
July 20, 2026 a 09:00 am
TPL: Analysts Ratings - Texas Pacific Land Corporation

TPL: Comprehensive breakdown of current and historical analyst ratings, offering insights into how expert sentiment has evolved over time.
July 20, 2026 a 08:38 am
CNP: Fundamental Ratio Analysis - CenterPoint Energy Inc
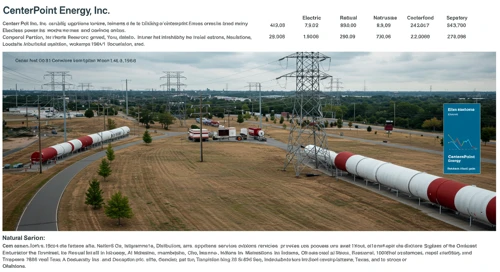
CNP: Evaluation of key financial ratios, analyst ratings, and price targets. A data-driven perspective on the valuation and market expectations.
July 20, 2026 a 08:00 am
APO: Dividend Analysis - Apollo Global Management Inc
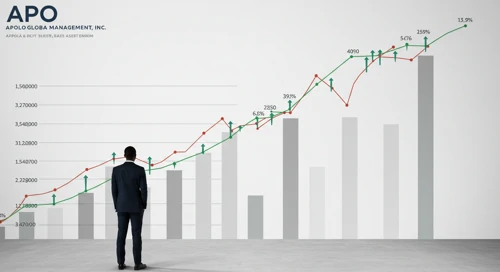
APO: In-depth analysis of a company's dividend stability and key fundamental ratios to assess its financial strength and long-term investment potential.
July 20, 2026 a 07:46 am
DVN: Fundamental Ratio Analysis - Devon Energy Corporation

DVN: Evaluation of key financial ratios, analyst ratings, and price targets. A data-driven perspective on the valuation and market expectations.
July 20, 2026 a 07:43 am
EQR: Dividend Analysis - Equity Residential

EQR: In-depth analysis of a company's dividend stability and key fundamental ratios to assess its financial strength and long-term investment potential.
July 20, 2026 a 07:31 am
Stock Market - Heatmap
Use mouse wheel to zoom in and out. Click a ticker to display detailed information in a new window. Hover mouse cursor over a ticker to see more data.
Stock's
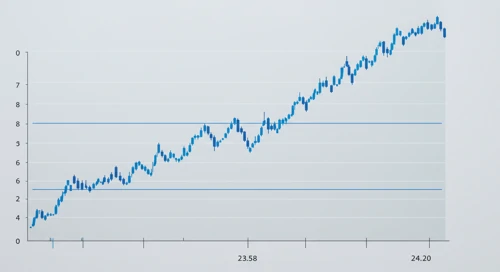
GEN: Trend with Support and Resistance Levels - Gen Digital Inc
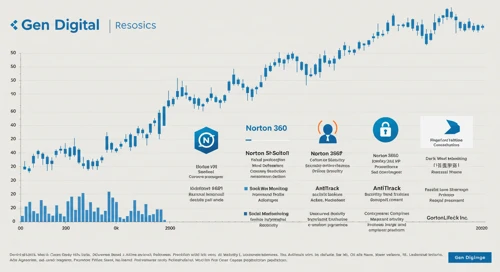
GEN: Current price trend is evaluated alongside key support and resistance level. View of potential turning points and price momentum.
July 20, 2026 a 03:15 am
MCD: Dividend Analysis - McDonalds Corporation
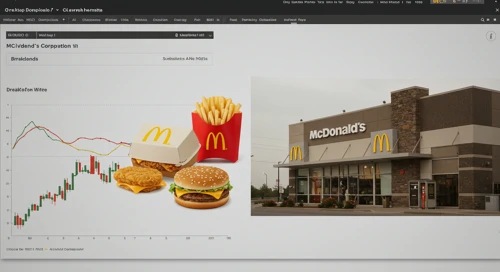
MCD: In-depth analysis of a company's dividend stability and key fundamental ratios to assess its financial strength and long-term investment potential.
July 20, 2026 a 02:46 am
INTU: Analysts Ratings - Intuit Inc
INTU: Comprehensive breakdown of current and historical analyst ratings, offering insights into how expert sentiment has evolved over time.
July 19, 2026 a 09:00 pm
NOW: Analysts Ratings - ServiceNow Inc
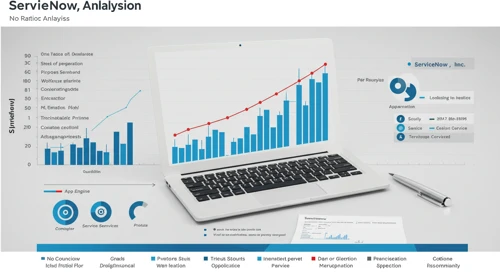
NOW: Comprehensive breakdown of current and historical analyst ratings, offering insights into how expert sentiment has evolved over time.
July 19, 2026 a 08:38 pm
MCHP: Fundamental Ratio Analysis - Microchip Technology Incorporated
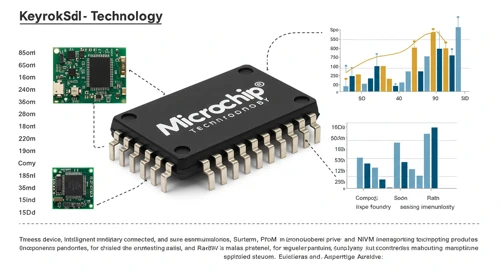
MCHP: Evaluation of key financial ratios, analyst ratings, and price targets. A data-driven perspective on the valuation and market expectations.
July 19, 2026 a 07:43 pm
TSCO: Fundamental Ratio Analysis - Tractor Supply Company

TSCO: Evaluation of key financial ratios, analyst ratings, and price targets. A data-driven perspective on the valuation and market expectations.
July 19, 2026 a 06:00 pm
STLD: Analysts Ratings - Steel Dynamics Inc
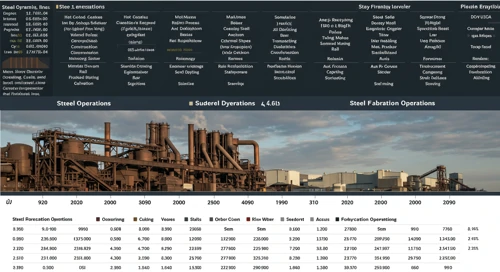
STLD: Comprehensive breakdown of current and historical analyst ratings, offering insights into how expert sentiment has evolved over time.
July 19, 2026 a 05:00 pm
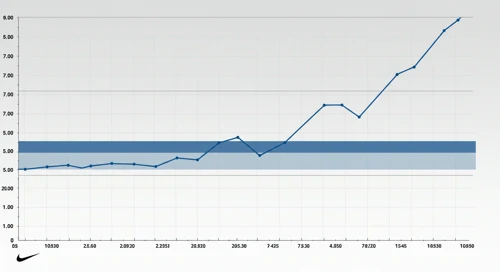
NKE: Fibunacci Level Technical Analysis - NIKE Inc
July 20, 2026 a 06:44 am
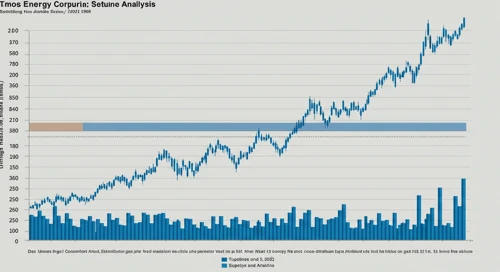
ATO: Fibunacci Level Technical Analysis - Atmos Energy Corporation
July 20, 2026 a 05:15 am

HON: Trend with Support and Resistance Levels - Honeywell International Inc
July 20, 2026 a 04:03 am
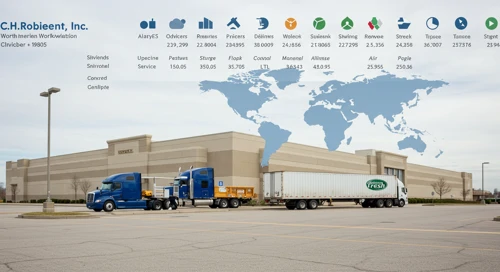
CHRW: Dividend Analysis - CH Robinson Worldwide Inc
July 20, 2026 a 03:30 am
CL: Fibunacci Level Technical Analysis - Colgate Palmolive Company
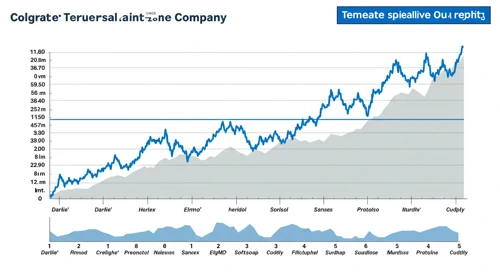
CL: Fibonacci retracement levels to identify key potential support and resistance zones, based on recent price trends.
July 19, 2026 a 04:44 pm
APH: Analysts Ratings - Amphenol Corporation
APH: Comprehensive breakdown of current and historical analyst ratings, offering insights into how expert sentiment has evolved over time.
July 19, 2026 a 04:38 pm
STX: Fundamental Ratio Analysis - Seagate Technology Holdings plc
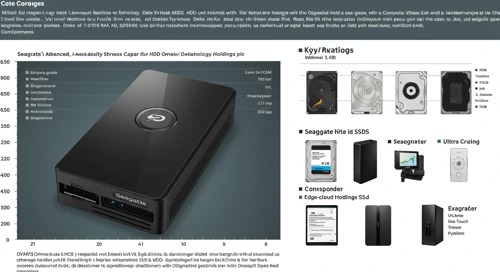
STX: Evaluation of key financial ratios, analyst ratings, and price targets. A data-driven perspective on the valuation and market expectations.
July 19, 2026 a 03:43 pm
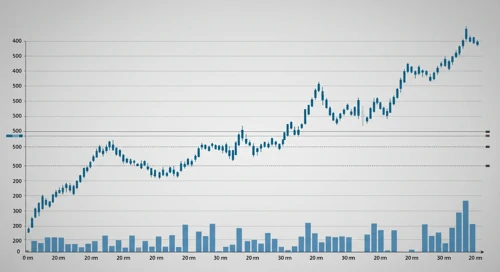
IBM: Dividend Analysis - International Business Machines Corporation
IBM: In-depth analysis of a company's dividend stability and key fundamental ratios to assess its financial strength and long-term investment potential.
July 19, 2026 a 03:31 pm
TAP: Fibunacci Level Technical Analysis - Molson Coors Beverage Company
TAP: Fibonacci retracement levels to identify key potential support and resistance zones, based on recent price trends.
July 19, 2026 a 03:15 pm
PODD: Trend with Support and Resistance Levels - Insulet Corp
PODD: Current price trend is evaluated alongside key support and resistance level. View of potential turning points and price momentum.
July 19, 2026 a 02:03 pm
PSX: Trend with Support and Resistance Levels - Phillips 66
PSX: Current price trend is evaluated alongside key support and resistance level. View of potential turning points and price momentum.
July 19, 2026 a 01:15 pm
Economic Calendar
Currencies
GBPCAD: Fibunacci Level Technical Analysis
GBPCAD: Fibonacci retracement levels to identify key potential support and resistance zones, based on recent price trends.
July 18, 2026 a 05:08 am
NZDCAD: Trend with Support and Resistance Levels
NZDCAD: Current price trend is evaluated alongside key support and resistance level. View of potential turning points and price momentum.
July 18, 2026 a 04:28 am
Todays Important Key Figures 18 Jul
Today’s important economic data releases – a snapshot of key indicators influencing markets and shaping financial expectations.
July 17, 2026 a 11:00 pm
Todays Important Key Figures 17 Jul

Today’s important economic data releases – a snapshot of key indicators influencing markets and shaping financial expectations.
July 17, 2026 a 07:00 pm
GBPUSD: Fibunacci Level Technical Analysis
GBPUSD: Fibonacci retracement levels to identify key potential support and resistance zones, based on recent price trends.
July 17, 2026 a 05:08 am
CHFJPY: Trend with Support and Resistance Levels
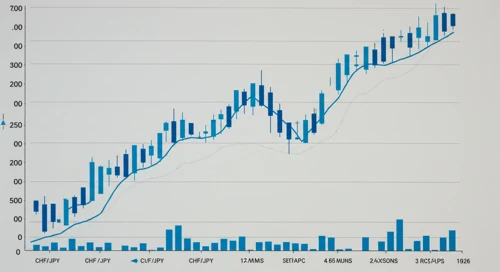
CHFJPY: Current price trend is evaluated alongside key support and resistance level. View of potential turning points and price momentum.
July 17, 2026 a 04:28 am
Todays Important Key Figures 16 Jul
Today’s important economic data releases – a snapshot of key indicators influencing markets and shaping financial expectations.
July 16, 2026 a 07:00 pm
EURCHF: Fibunacci Level Technical Analysis
July 20, 2026 a 05:08 am
EURUSD: Trend with Support and Resistance Levels
July 20, 2026 a 04:28 am
GBPAUD: Fibunacci Level Technical Analysis
July 19, 2026 a 05:08 am
GBPNZD: Trend with Support and Resistance Levels
July 19, 2026 a 04:28 am
CADJPY: Fibunacci Level Technical Analysis
CADJPY: Fibonacci retracement levels to identify key potential support and resistance zones, based on recent price trends.
July 16, 2026 a 05:08 am
EURAUD: Trend with Support and Resistance Levels
EURAUD: Current price trend is evaluated alongside key support and resistance level. View of potential turning points and price momentum.
July 16, 2026 a 04:28 am
Important Key Figures of the last Days

Overview of key economic indicators released over the past days, highlighting their potential impact on markets and investor sentiment.
July 16, 2026 a 02:31 am
Todays Important Key Figures 15 Jul

Today’s important economic data releases – a snapshot of key indicators influencing markets and shaping financial expectations.
July 15, 2026 a 07:00 pm
CADCHF: Fibunacci Level Technical Analysis
CADCHF: Fibonacci retracement levels to identify key potential support and resistance zones, based on recent price trends.
July 15, 2026 a 05:08 am
GBPSEK: Trend with Support and Resistance Levels
GBPSEK: Current price trend is evaluated alongside key support and resistance level. View of potential turning points and price momentum.
July 15, 2026 a 04:28 am
Todays Important Key Figures 14 Jul

Today’s important economic data releases – a snapshot of key indicators influencing markets and shaping financial expectations.
July 14, 2026 a 07:00 pm
Currencies