April 25, 2026 a 02:46 am

PKG: Dividend Analysis - Packaging Corporation of America
The Packaging Corporation of America has demonstrated a stable and consistent dividend profile over the years. This analysis explores the company's dividend yield, historical performance, and growth potential. With a dividend history spanning over two decades, PKG is a promising candidate for income-focused investors seeking long-term stability.
📊 Overview
Packaging Corporation of America operates in the Industrial Sector and offers a dividend yield of 2.33%. With a current dividend per share of $4.99 and a history of 24 years of consistent dividends, the company has shown resilience. The last occurrence of a dividend cut or suspension is absent, indicating a strong commitment to shareholder returns.
| Metric | Value |
|---|---|
| Sector | Industrial |
| Dividend Yield | 2.33% |
| Current Dividend per Share | $4.99 USD |
| Dividend History | 24 years |
| Last Cut or Suspension | None |
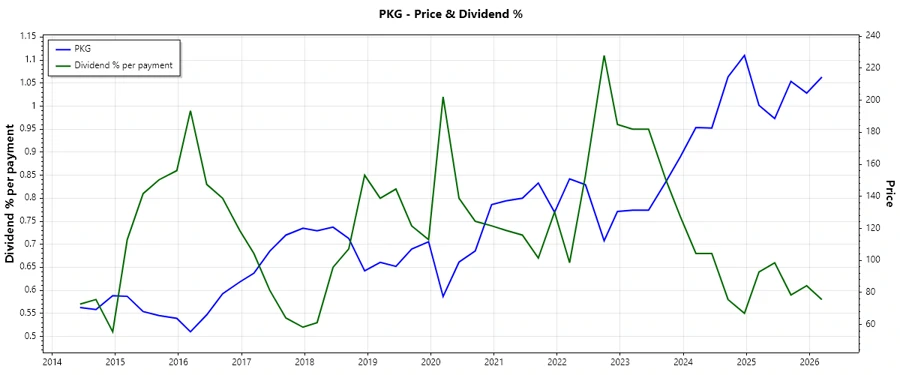
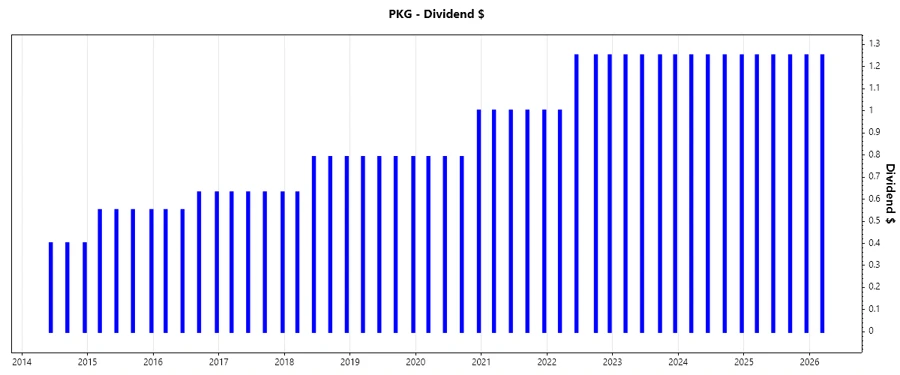
🗣️ Dividend History
Understanding the dividend history is crucial for assessing the reliability and consistency of returns. PKG has maintained a robust and stable dividend history, reflecting solid financial health and shareholder commitment.
| Year | Dividend per Share (USD) |
|---|---|
| 2026 | 1.25 |
| 2025 | 5.00 |
| 2024 | 5.00 |
| 2023 | 5.00 |
| 2022 | 4.75 |
📈 Dividend Growth
Growth in dividends reflects the company's ability to generate increasing income over time. PKG's dividends have grown by 1.72% over the last 3 years and 8.21% over 5 years. This growth indicates a moderate yet reliable increase in shareholder returns.
| Time | Growth (%) |
|---|---|
| 3 years | 1.72% |
| 5 years | 8.21% |
The average dividend growth is 8.21% over 5 years. This shows moderate but steady dividend growth.
📉 Payout Ratio
The payout ratio indicates the proportion of earnings distributed as dividends. PKG maintains an EPS-based payout ratio of 59.64% and a free cash flow-based ratio of 61.14%, suggesting a balanced approach to reinvestment and dividend payments.
| Key Figure | Ratio |
|---|---|
| EPS-based | 59.64% |
| Free Cash Flow-based | 61.14% |
A payout ratio near 60% reflects financial discipline, ensuring adequate cash retention for growth and opportunities.
✅ Cashflow & Capital Efficiency
Analyzing cash flow and capital efficiency provides insights into the company's operational health and reinvestment capacity. PKG displays a steady cash flow, supporting continuous investment in operational capabilities and maintaining shareholder returns.
| Metric | 2025 | 2024 | 2023 |
|---|---|---|---|
| Free Cash Flow Yield | 3.92% | 2.60% | 5.82% |
| Earnings Yield | 4.14% | 4.01% | 5.27% |
| CAPEX to Operating Cash Flow | 53.22% | 56.22% | 35.72% |
| Stock-based Compensation to Revenue | 0.50% | 0.58% | 0.51% |
| Free Cash Flow / Operating Cash Flow Ratio | 46.78% | 43.78% | 64.28% |
PKG's efficient use of capital supports its operational stability and offers a positive outlook on future capital returns.
📈 Balance Sheet & Leverage Analysis
A strong balance sheet is crucial for financial resilience and managing leverage effectively. Analyzing leverage ratios reveals PKG's solid financial foundation capable of withstanding economic fluctuations.
| Metric | 2025 | 2024 | 2023 |
|---|---|---|---|
| Debt-to-Equity | 0.95 | 0.63 | 0.79 |
| Debt-to-Assets | 0.40 | 0.31 | 0.37 |
| Debt-to-Capital | 0.49 | 0.39 | 0.44 |
| Net Debt to EBITDA | 2.18 | 1.28 | 1.59 |
| Current Ratio | 3.17 | 3.23 | 2.57 |
| Quick Ratio | 1.94 | 2.10 | 1.77 |
| Financial Leverage | 2.38 | 2.01 | 2.17 |
PKG demonstrates prudent debt management and adequate liquidity, indicating a robust capacity to service debt and facilitate growth projects.
📊 Fundamental Strength & Profitability
Analyzing fundamental and profitability metrics gauges a company's financial efficiency and competitiveness. PKG's strong ROE and diverse margins indicate balanced operations and effective asset use.
| Metric | 2025 | 2024 | 2023 |
|---|---|---|---|
| Return on Equity | 16.72% | 18.28% | 19.14% |
| Return on Assets | 7.04% | 9.11% | 8.81% |
| Net Margin | 8.55% | 9.60% | 9.81% |
| EBIT Margin | 12.31% | 13.19% | 13.68% |
| EBITDA Margin | 19.58% | 19.46% | 20.32% |
| Gross Margin | 21.02% | 21.27% | 21.77% |
| R&D to Revenue | 0.00% | 0.00% | 0.00% |
With robust returns and high margins, PKG's operational efficiency positions it well within its industry, ensuring continued profitability.
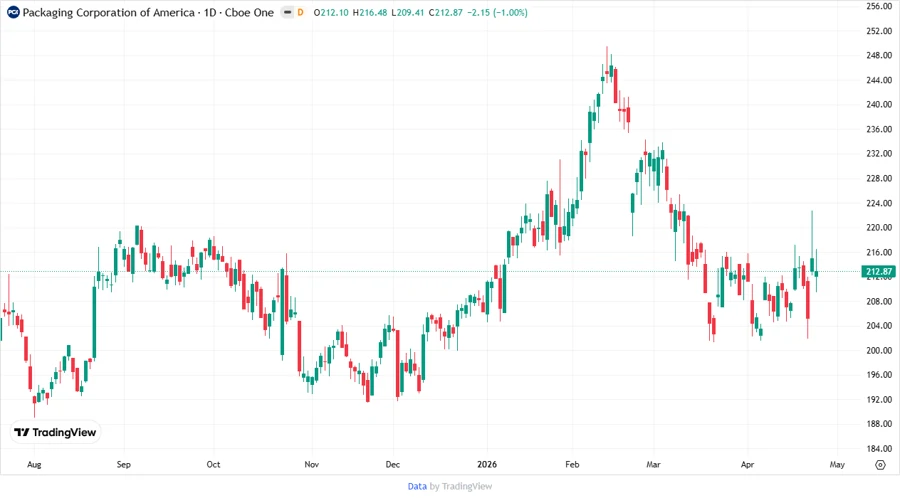
📈 Price Development
🔍 Dividend Scoring System
An objective assessment via the Dividend Scoring System evaluates diverse criteria to gauge overall dividend performance.
| Category | Score (1-5) | Score Bar |
|---|---|---|
| Dividend Yield | 3 | |
| Dividend Stability | 4 | |
| Dividend Growth | 3 | |
| Payout Ratio | 3 | |
| Financial Stability | 4 | |
| Dividend Continuity | 5 | |
| Cashflow Coverage | 4 | |
| Balance Sheet Quality | 4 |
Total Score: 30/40
✅ Rating
Overall, Packaging Corporation of America offers a reliable and consistent dividend profile suited for conservative investors seeking stability and moderate growth. The company's effective capital allocation strategies and robust financial health underline its capability to sustain shareholder returns. PKG receives a favorable rating, making it an attractive option for long-term dividend portfolios.
Smart Data Insight
Master the Perfect Entry & Exit for this Stock
Don't leave your profits to chance. Historically, this stock follows specific seasonal patterns that institutional traders use to maximize returns.
- ✅ Identify the "Golden Buying Window"
- ✅ Avoid high-risk correction cycles
- ✅ Backtested data from the last 20+ years