February 11, 2026 a 11:31 am
PKG: Dividend Analysis - Packaging Corporation of America
The Packaging Corporation of America presents a robust dividend profile with a competitive yield and a solid history of dividend payments. With its solid market cap and strong financial ratios, the company has a stable base for investors seeking reliable income. However, investors should be aware of the company's payout ratios and evaluate their implications for future dividend sustainability.
Overview 📊
Packaging Corporation of America operates within the materials sector, delivering a current dividend yield of 2.45% with a dividend per share of 5 USD. The company boasts a commendable 23-year history of dividend payments, having last cut or suspended its dividend in 2009, which depicts its commitment to returning value to shareholders.
| Sector | Dividend Yield | Current Dividend Per Share | Dividend History | Last Cut/Suspension |
|---|---|---|---|---|
| Materials | 2.45% | 5 USD | 23 years | 2009 |
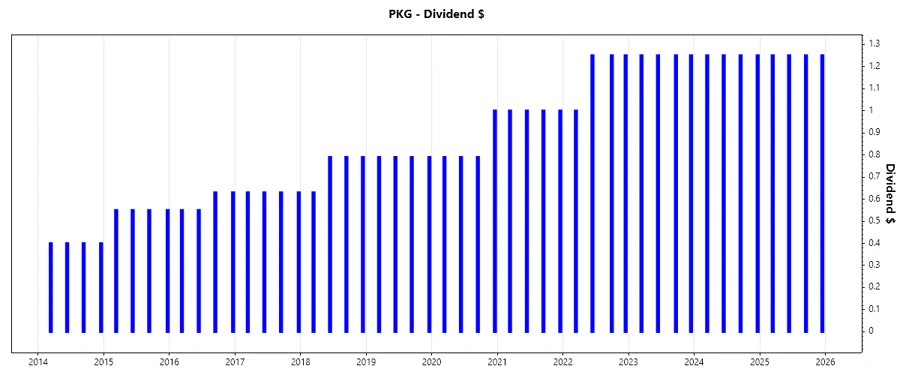
Dividend History 🗣️
The historical consistency of dividends provides investors with a predictable income stream, essential for maintaining confidence in long-term financial planning. The company maintains a firm commitment to shareholder returns, offering stable dividends as evidenced by the payments in recent years.
| Year | Dividend Per Share (USD) |
|---|---|
| 2025 | 5.00 |
| 2024 | 5.00 |
| 2023 | 5.00 |
| 2022 | 4.75 |
| 2021 | 4.00 |
Dividend Growth 📈
Analyzing the growth of dividends over time is vital, reflecting the company's capacity to increase payouts which align with its earnings growth. Such trends highlight the potential for compounding investor wealth through reinvestment.
| Time | Growth |
|---|---|
| 3 years | 1.72% |
| 5 years | 8.21% |
The average dividend growth is 8.21% over 5 years. This shows moderate but steady dividend growth.
Payout Ratio 📉
The payout ratio reflects the proportion of earnings paid as dividends, providing insights into dividend sustainability. A high payout may signal limited reinvestment capacity, whereas a too low ratio might suggest missed income distribution opportunities.
| Key Figure | Ratio |
|---|---|
| EPS-based | 73.87% |
| Free Cash Flow-based | 62.04% |
The EPS payout ratio of 73.87% and the FCF payout ratio of 62.04% suggest a significant portion of earnings are being distributed as dividends, which could limit future growth investments.
Cashflow & Capital Efficiency
Robust cash flow and efficient capital usage underpin a company's ability to maintain dividend payouts and invest in growth. These benchmarks are critical in assessing overall financial health.
| Metric | 2023 | 2024 | 2025 |
|---|---|---|---|
| Free Cash Flow Yield | 5.82% | 2.60% | 0% |
| Earnings Yield | 5.27% | 4.01% | 3.26% |
| CAPEX to Operating Cash Flow | 35.72% | 56.22% | 0% |
| Stock-based Compensation to Revenue | 0.51% | 0.58% | 0% |
| Free Cash Flow / Operating Cash Flow Ratio | 64.28% | 43.78% | 0% |
The diminishing free cash flow yield indicates challenging periods, but earnings yield remains positive, suggesting profitability amidst the operational headwinds.
Balance Sheet & Leverage Analysis
Evaluating leverage and balance sheet ratios reveals a company's financial stability. Understanding these measures is critical to assessing long-term solvency and liquidity.
| Metric | 2023 | 2024 | 2025 |
|---|---|---|---|
| Debt-to-Equity | 79.38% | 62.93% | 0% |
| Debt-to-Assets | 36.55% | 31.38% | 0% |
| Debt-to-Capital | 44.25% | 38.62% | 0% |
| Net Debt to EBITDA | 1.59x | 1.28x | 0x |
| Current Ratio | 2.57 | 3.23 | 0 or Undefined |
| Quick Ratio | 1.77 | 2.10 | 0 or Undefined |
The company's leverage metrics are improving, indicating prudent debt management, while maintaining liquidity with solid current and quick ratios.
Fundamental Strength & Profitability
Fundamental and profitability ratios gauge the efficiency and performance of the business, offering insights into operational health and shareholder returns.
| Metric | 2023 | 2024 | 2025 |
|---|---|---|---|
| Return on Equity | 19.14% | 18.28% | 0% |
| Return on Assets | 8.81% | 9.11% | 0% |
| Net Margin | 9.81% | 9.60% | 8.55% |
| EBIT Margin | 13.68% | 13.19% | 12.31% |
| EBITDA Margin | 20.32% | 19.46% | 19.57% |
| Gross Margin | 21.77% | 21.27% | 21.02% |
Packaging Corporation of America displays consistent profitability, evident in high ROE and stable net margins, indicating a well-managed enterprise that efficiently converts revenues to earnings.
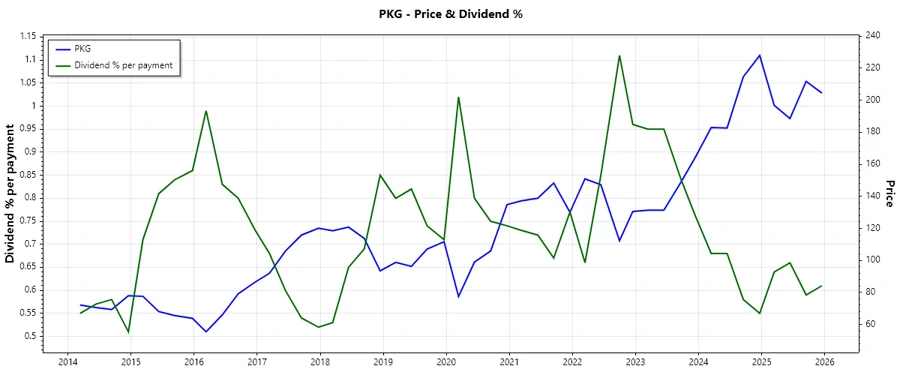
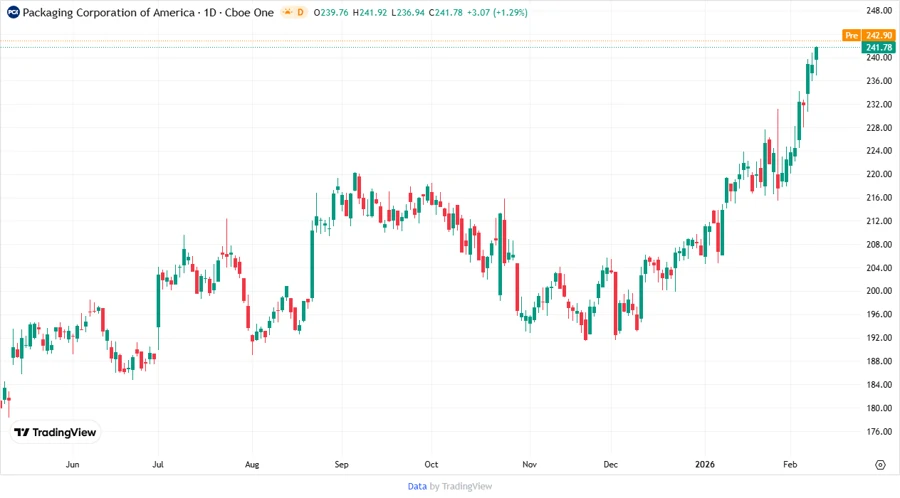
Price Development
Dividend Scoring System ✅
| Criteria | Score | Score Bar |
|---|---|---|
| Dividend yield | 3 | |
| Dividend Stability | 4 | |
| Dividend growth | 3 | |
| Payout ratio | 2 | |
| Financial stability | 4 | |
| Dividend continuity | 4 | |
| Cashflow Coverage | 3 | |
| Balance Sheet Quality | 4 |
Total Score: 27/40
Rating
The Packaging Corporation of America is a dependable dividend-paying entity demonstrating resilience and moderate growth, suitable for conservative income-focused investors. Despite its high payout ratios, its financial stability and profitability offer confidence in its sustained dividend policy.
Smart Data Insight
Master the Perfect Entry & Exit for this Stock
Don't leave your profits to chance. Historically, this stock follows specific seasonal patterns that institutional traders use to maximize returns.
- ✅ Identify the "Golden Buying Window"
- ✅ Avoid high-risk correction cycles
- ✅ Backtested data from the last 20+ years