December 16, 2025 a 07:46 am
PKG: Dividend Analysis - Packaging Corporation of America
The Packaging Corporation of America (PKG) exhibits robust dividend attributes, highlighted by a steady history of payouts and moderate growth. The company's strong financial health, marked by solid returns on assets and equity, underpins its sustainable shareholder returns. The strategic management of its payout ratios also suggests a careful balancing of reinvestment and rewarding shareholders, reinforcing PKG's stability in dividend sustainability.
📊 Overview
Packaging Corporation of America operates within the packaging sector and stands out for a robust financial structure that allows for consistent dividend offerings. Below is a snapshot of key dividend metrics:
| Attribute | Details |
|---|---|
| Sector | Packaging |
| Dividend Yield | 2.44% |
| Current Dividend per Share | 5.04 USD |
| Dividend History | 23 years |
| Last Cut/Suspension | 2009 |
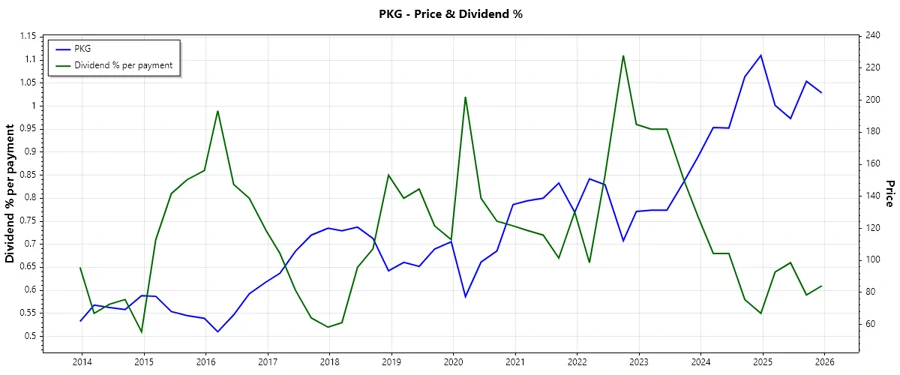
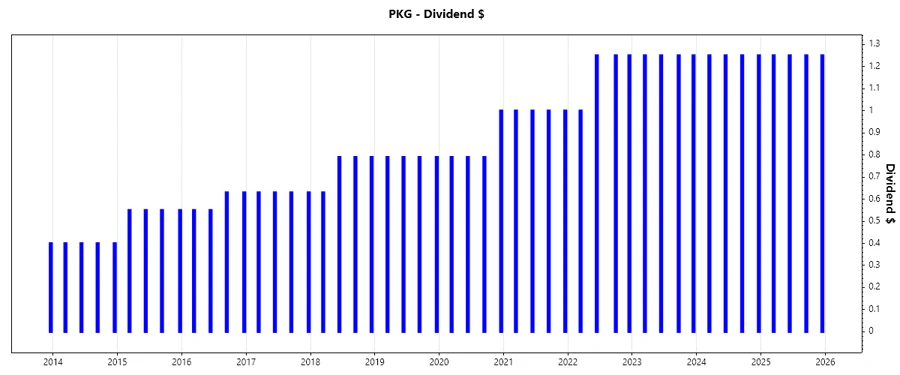
🗣️ Dividend History
The company's dividend history is a testament to its commitment to returning value to shareholders, with a stable and growing dividend stream over the years. This continuity instills confidence in PKG's long-term financial planning and resilience.
| Year | Dividend per Share |
|---|---|
| 2025 | 5.00 |
| 2024 | 5.00 |
| 2023 | 5.00 |
| 2022 | 4.75 |
| 2021 | 4.00 |
📈 Dividend Growth
Analyzing dividend growth gives insights into the company’s performance and potential increases in shareholder returns. PKG exhibits a steady dividend growth pattern that indicates robust financial health and strategic reinvestment.
| Time | Growth |
|---|---|
| 3 years | 7.72% |
| 5 years | 9.61% |
The average dividend growth is 9.61% over 5 years, showcasing moderate but steady dividend growth, thus reassuring investors of potential future benefit from the company’s earnings.
⚖️ Payout Ratio
Payout ratios provide an indication of how well earnings and cash flows support dividend payouts. PKG's payout ratios are indicative of a balanced approach between rewarding shareholders and sustaining capital for future operations.
| Key Figure | Ratio |
|---|---|
| EPS-based | 50.77% |
| Free cash flow-based | 62.50% |
The EPS-based payout ratio of 50.77% shows a stable alignment with business profitability, while the 62.50% FCF-based ratio reflects cash management efficiency, underscoring PKG’s commitment to maintaining both investor returns and operational sustainability.
📊 Cashflow & Capital Efficiency
The analysis of cashflow and capital efficiency reveals the company's ability to generate cash relative to its operational needs and its effectiveness in using capital to produce returns. These metrics are critical for understanding long-term sustainability.
| Year | 2024 | 2023 | 2022 |
|---|---|---|---|
| Free Cash Flow Yield | 2.60% | 5.82% | 5.68% |
| Earnings Yield | 4.01% | 5.27% | 8.72% |
| CAPEX to Operating Cash Flow | 56.22% | 35.72% | 55.13% |
| Stock-based Compensation to Revenue | 0.58% | 0.51% | 0.42% |
| Free Cash Flow / Operating Cash Flow Ratio | 43.78% | 64.28% | 44.87% |
PKG's financial health in terms of free cash flow and capital efficiency suggests reliable cash generation that supports both operational growth and shareholder distribution efficiently.
📊 Balance Sheet & Leverage Analysis
Evaluating the balance sheet and leverage provides key insights into the company’s debt management and liquidity position. These elements are vital for assessing long-term financial stability.
| Year | 2024 | 2023 | 2022 |
|---|---|---|---|
| Debt-to-Equity | 0.63 | 0.79 | 0.76 |
| Debt-to-Assets | 0.31 | 0.37 | 0.35 |
| Debt-to-Capital | 0.39 | 0.44 | 0.43 |
| Net Debt to EBITDA | 1.28 | 1.59 | 1.31 |
| Current Ratio | 3.16 | 2.57 | 2.86 |
| Quick Ratio | 2.10 | 1.77 | 1.75 |
| Financial Leverage | 2.01 | 2.17 | 2.18 |
The financial ratios indicate a well-managed debt level and strong liquidity which are essential for maintaining resilience against economic fluctuations and sustaining growth.
📊 Fundamental Strength & Profitability
Assessing fundamental strength and profitability is paramount for understanding how effectively PKG is operating. This area focuses on how profitable and resource-efficient the company is.
| Year | 2024 | 2023 | 2022 |
|---|---|---|---|
| Return on Equity | 18.28% | 19.14% | 28.08% |
| Return on Assets | 9.11% | 8.81% | 12.87% |
| Net Margin | 9.60% | 9.81% | 12.15% |
| EBIT Margin | 13.19% | 13.68% | 16.93% |
| EBITDA Margin | 19.46% | 20.32% | 22.32% |
| Gross Margin | 21.27% | 21.77% | 24.66% |
| Research & Development to Revenue | 0% | 0% | 0% |
PKG's strong ROE and impressive profit margins signify operational efficiency and managerial effectiveness, translating directly to shareholder value.
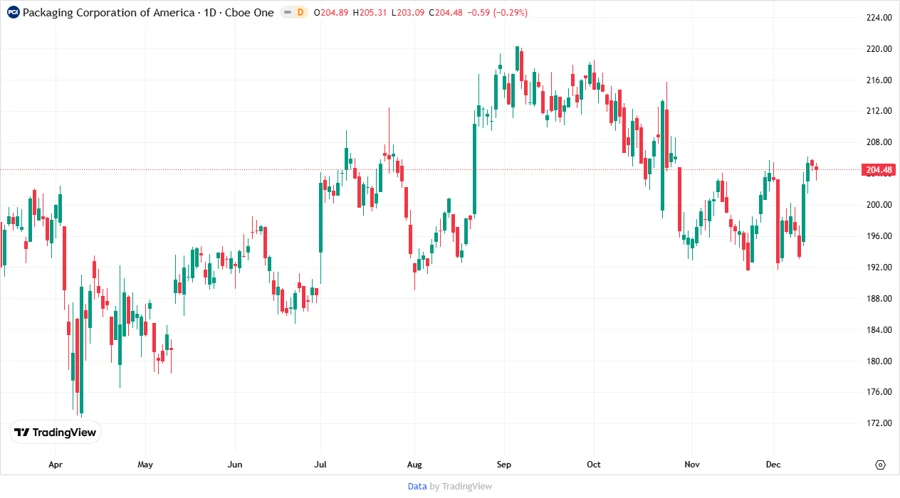
📈 Price Development
✅ Dividend Scoring System
The dividend scoring provides an evaluative framework, assessing the stability and reliability of dividends, crucial for long-term investment decisions.
| Category | Details | Score |
|---|---|---|
| Dividend Yield | 2.44% | 3/5 |
| Dividend Stability | 23 years of history | 4/5 |
| Dividend Growth | 9.61% over 5 years | 4/5 |
| Payout Ratio | Balance with growth | 4/5 |
| Financial Stability | Strong liquidity ratios | 4/5 |
| Dividend Continuity | No recent cuts since 2009 | 4/5 |
| Cashflow Coverage | Consistent | 3/5 |
| Balance Sheet Quality | Healthy leverage ratios | 4/5 |
Overall Score: 30/40
📉 Rating
Based on the comprehensive analysis, PKG presents a reliable dividend landscape backed by strong financial metrics and reasonable growth potential. With sound management of payout ratios and sustained historical performance, PKG positions itself as an attractive option for dividend-focused investors seeking stability and moderate growth. The recommendation is to consider adding PKG to diversified income portfolios.