October 29, 2025 a 07:46 am


PKG: Dividend Analysis - Packaging Corporation of America
The Packaging Corporation of America (PKG) shows a promising dividend profile with a consistent payout history over the past 23 years. The company's current dividend yield stands at 2.36%, aligning with industry standards and providing a solid income source for long-term investors. Despite a modest growth rate, PKG has demonstrated reliability in its dividend distributions, making it a potentially attractive option for income-focused investors.
📊 Overview
The Packaging Corporation of America operates within the Packaging Sector. Here is a brief overview of its current dividend metrics:
| Metric | Value |
|---|---|
| Sector | Packaging |
| Dividend Yield | 2.36% |
| Current Dividend per Share | 5.04 USD |
| Dividend History | 23 years |
| Last Cut or Suspension | None |
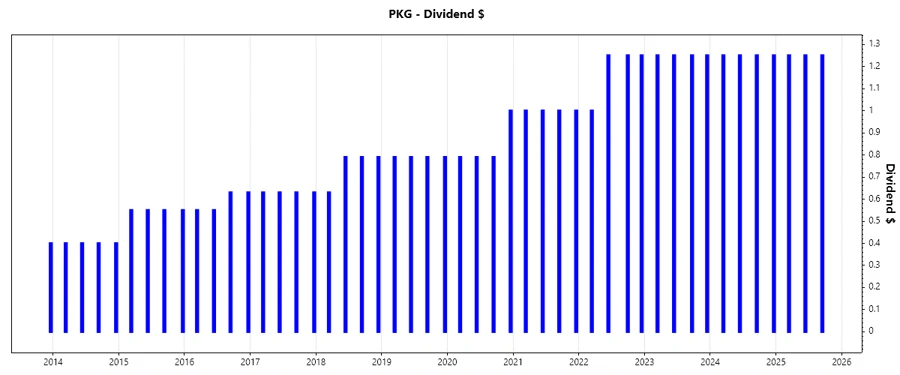
📈 Dividend History
Examining the company's dividend history is crucial to determine its reliability in providing shareholder returns over time. A steady or increasing dividend payment can signify a financially sound and shareholder-focused company. Below is an image illustrating stock performance over the years:
| Year | Dividend per Share (USD) |
|---|---|
| 2025 | 3.75 |
| 2024 | 5.00 |
| 2023 | 5.00 |
| 2022 | 4.75 |
| 2021 | 4.00 |
🗣️ Dividend Growth
The pattern of dividend growth is a key indicator of the company's potential to increase shareholder returns. Recent growth rates indicate a steady climb over the years:
| Time | Growth |
|---|---|
| 3 years | 7.72% |
| 5 years | 9.61% |
The average dividend growth is 9.61% over 5 years. This shows moderate but steady dividend growth, highlighting PKG's commitment to enhancing shareholder value over time.
📉 Payout Ratio
A critical metric for evaluating dividend sustainability is how much profit is returned to shareholders as dividends. Ratios vary according to the source of the payout, either earnings or free cash flow:
| Key Figure | Ratio |
|---|---|
| EPS-based | 50.61% |
| Free Cash Flow-based | 72.47% |
A payout ratio of 50.61% based on EPS ensures sufficient reinvestment into the company, while the 72.47% FCF-based ratio supports current dividends, but requires monitoring for future increases.
✅ Cashflow & Capital Efficiency
Cash flow metrics deliver insights into corporate efficiency in converting revenue into profit. Here we assess PKG’s ability to generate cash and manage expenses:
| Metric | 2024 | 2023 | 2022 |
|---|---|---|---|
| Free Cash Flow Yield | 2.60% | 5.82% | 5.68% |
| Earnings Yield | 4.01% | 5.27% | 8.72% |
| CAPEX to Operating Cash Flow | 51.56% | 35.72% | 55.13% |
| Stock-based Compensation to Revenue | 0.58% | 0.51% | 0.42% |
| Free Cash Flow / Operating Cash Flow Ratio | 43.78% | 64.28% | 44.87% |
PKG demonstrates robust cash flow generation with a stable CAPEX efficiency, providing potential for sustainable capital returns to investors.
⚠️ Balance Sheet & Leverage Analysis
A well-balanced leverage position ensures continuing operations without overbearing debt levels. The following metrics indicate PKG's current leverage and liquidity status:
| Metric | 2024 | 2023 | 2022 |
|---|---|---|---|
| Debt-to-Equity | 62.93% | 79.38% | 76.17% |
| Debt-to-Assets | 31.38% | 36.55% | 34.90% |
| Debt-to-Capital | 38.62% | 44.25% | 43.24% |
| Net Debt to EBITDA | 1.28 | 1.59 | 1.31 |
| Current Ratio | 3.54 | - | - |
| Quick Ratio | 2.10 | 1.77 | 1.75 |
| Financial Leverage | 2.01 | 2.17 | 2.18 |
The company's stable debt matrices and liquidity reveals prudent financial management, ensuring PKG's ability to meet future capital needs effectively.
📊 Fundamental Strength & Profitability
Profitability metrics offer insights into operational efficiency and return capabilities, crucial for evaluating long-term viability:
| Metric | 2024 | 2023 | 2022 |
|---|---|---|---|
| Return on Equity | 18.28% | 19.14% | 28.08% |
| Return on Assets | 9.11% | 8.81% | 12.87% |
| Margins: Net | 9.60% | 9.81% | 12.15% |
| EBIT Margin | 13.19% | 13.68% | 16.93% |
| EBITDA Margin | 19.46% | 20.32% | 22.32% |
| Gross Margin | 21.27% | 21.77% | 24.66% |
| Research & Development to Revenue | 0% | 0% | 0% |
Packaging Corporation of America shows solid return metrics with increasing efficiency over the years, bolstering its potential as a profitable investment.
📈 Price Development
🗂️ Dividend Scoring System
| Category | Score | |
|---|---|---|
| Dividend Yield | 3 | |
| Dividend Stability | 4 | |
| Dividend Growth | 3 | |
| Payout Ratio | 4 | |
| Financial Stability | 5 | |
| Dividend Continuity | 4 | |
| Cashflow Coverage | 4 | |
| Balance Sheet Quality | 4 |
Total Score: 31 / 40
📉 Rating
Packaging Corporation of America's dividend profile offers a stable yet modest return, appealing to risk-averse income investors. Supported by solid financials and prudent cash management, PKG can be considered a reliable income-generating stock with potential for modest capital appreciation. Overall, it provides a balanced investment opportunity with an emphasis on stability and consistent returns.
Smart Data Insight
Master the Perfect Entry & Exit for this Stock
Don't leave your profits to chance. Historically, this stock follows specific seasonal patterns that institutional traders use to maximize returns.
- ✅ Identify the "Golden Buying Window"
- ✅ Avoid high-risk correction cycles
- ✅ Backtested data from the last 20+ years