October 05, 2025 a 09:03 am
PH: Trend and Support & Resistance Analysis - Parker-Hannifin Corporation
The Parker-Hannifin Corporation shows strong resilience in its diversified industrial and aerospace systems businesses. The recent stock price data suggest the presence of significant market trends and key support and resistance levels, vital for strategic investment decisions. As we delve into the technical indicators, the observed trends will illuminate potential opportunities and risks for investors in the current market scenario.
Trend Analysis
| Date | Closing Price | Trend |
|---|---|---|
| 2025-10-03 | 763.23 | ▲ |
| 2025-10-02 | 758.14 | ▲ |
| 2025-10-01 | 755.22 | ▲ |
| 2025-09-30 | 758.15 | ▲ |
| 2025-09-29 | 753.57 | ▲ |
| 2025-09-26 | 750.72 | ▲ |
| 2025-09-25 | 745.08 | ▲ |
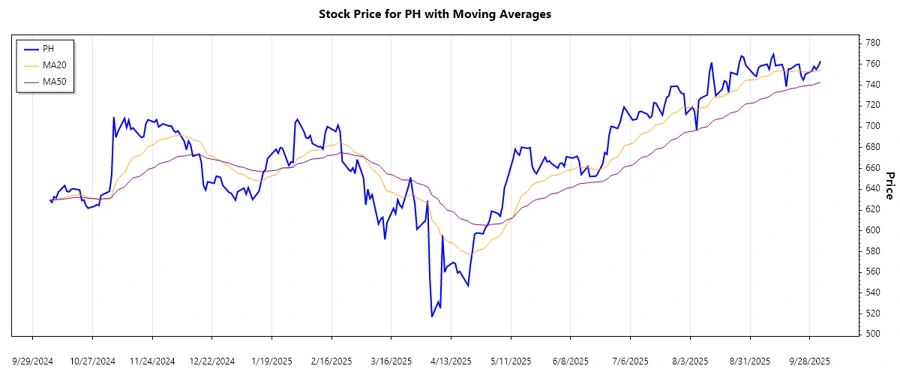
Based on the EMA analysis, a prevailing uptrend is detected as the EMA20 is above the EMA50 for most of the observed period. This indicates strong bullish sentiments among investors, suggesting further potential rise in stock price if this trend continues.
Support and Resistance
| Zone Type | From | To |
|---|---|---|
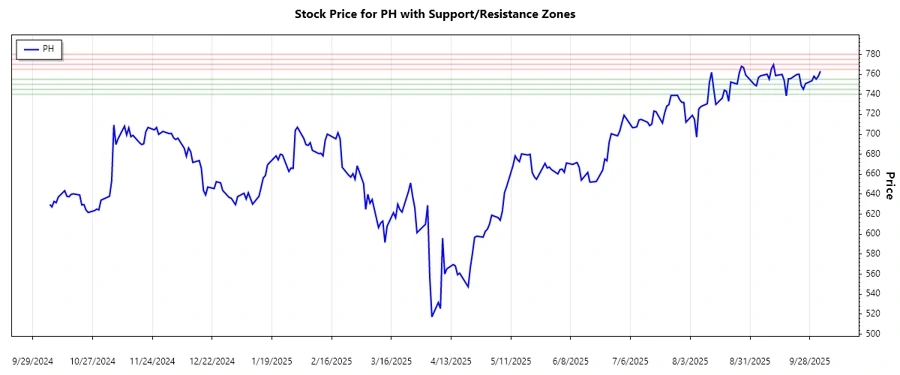
| Support Zone 1 | 750.00 | 755.00 |
| Support Zone 2 | 740.00 | 745.00 |
| Resistance Zone 1 | 765.00 | 770.00 |
| Resistance Zone 2 | 775.00 | 780.00 |
The current stock price is approaching the upper resistance zone, indicating potential selling pressure if it fails to break through. Investors might see a retracement if the price reaches these resistance levels without breaking above.
Conclusion
The Parker-Hannifin Corporation stock presents a compelling case for both short-term traders and long-term investors given its strong uptrend and key support and resistance areas. While the trend analysis suggests a bullish momentum, investors should remain cautious with the upcoming resistance levels that could reverse the current price trajectory. Combining these technical insights with fundamental analysis could enhance decision-making for potential investors.
Smart Data Insight
Master the Perfect Entry & Exit for this Stock
Don't leave your profits to chance. Historically, this stock follows specific seasonal patterns that institutional traders use to maximize returns.
- ✅ Identify the "Golden Buying Window"
- ✅ Avoid high-risk correction cycles
- ✅ Backtested data from the last 20+ years