
August 23, 2025 a 04:44 pm
PH: Fibonacci Analysis - Parker-Hannifin Corporation
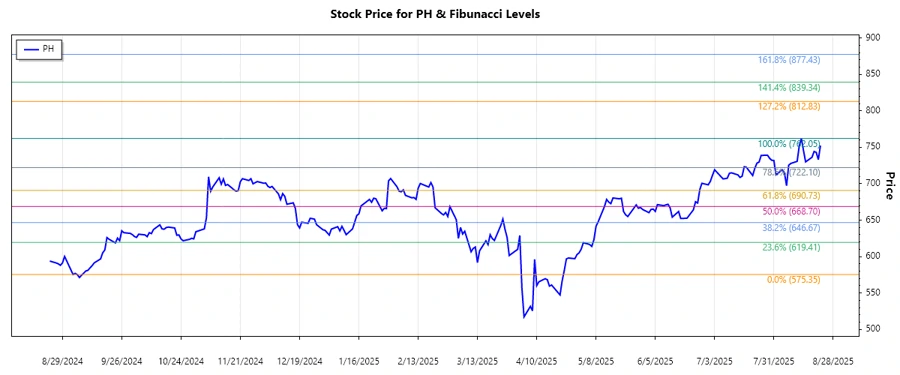
The Parker-Hannifin Corporation has experienced a considerable upward trend in recent months. With a diverse product offering across various industrial sectors, the company stands as a crucial player in motion and control technologies. Given its comprehensive market reach, Parker-Hannifin's stock has demonstrated resilience and potential for continued growth, making it an attractive prospect for investors focusing on the industrial sector. However, market volatility and the economic environment should be considered for future performance estimations.
Fibonacci Analysis
| Details | Data |
|---|---|
| Start Date of Trend | 2024-10-01 |
| End Date of Trend | 2025-08-22 |
| High Point (Price and Date) | $762.05 on 2025-08-13 |
| Low Point (Price and Date) | $575.35 on 2024-09-03 |
Fibonacci Retracement Levels
| Level | Price |
|---|---|
| 0.236 | $712.94 |
| 0.382 | $685.56 |
| 0.5 | $668.70 |
| 0.618 | $651.84 |
| 0.786 | $627.09 |
The current price of $752.33 is above the retracement levels, indicating a continuation of the upward trend. Technically, this suggests the stock may face resistance as it approaches previous highs, but it also indicates strong momentum that could lead to further gains.
Conclusion
Parker-Hannifin's stock has displayed a robust upward trajectory over the recent months, highlighting the company's strength and the investor confidence in its diversified market approach. While the current price exceeds key Fibonacci levels, potentially signaling overextension, it could also be indicative of the stock's potential to reach new highs. Analysts should monitor economic indicators and sector-specific risks. Should industry conditions remain favorable, and the company continues its innovative expansion, Parker-Hannifin may offer further growth opportunities. Nonetheless, investors should stay vigilant about external pressures that could impact future valuations.
Smart Data Insight
Master the Perfect Entry & Exit for this Stock
Don't leave your profits to chance. Historically, this stock follows specific seasonal patterns that institutional traders use to maximize returns.
- ✅ Identify the "Golden Buying Window"
- ✅ Avoid high-risk correction cycles
- ✅ Backtested data from the last 20+ years