June 11, 2026 a 07:31 am


PH: Dividend Analysis - Parker-Hannifin Corporation
Parker-Hannifin Corporation (PH) has proven itself as a resilient and consistent dividend payer. With a market capitalization of approximately $110 billion and a dividend history of 42 years, PH offers stability and a strong track record. The current dividend yield stands at 0.84%, and although this may seem modest, the steadfast growth and robust financial health reinforce its appeal to long-term investors.
📊 Overview
With a presence in the industrial sector, Parker-Hannifin's solid dividend track record, and an uninterrupted dividend history for over four decades, underline its commitment to shareholder returns. This consistency, combined with a moderate dividend yield and strategic reinvestment policies, position PH as a strong contender for dividend-focused portfolios.
| Parameter | Details |
|---|---|
| Sector | Industrial |
| Dividend yield | 0.84 % |
| Current dividend per share | 6.71 USD |
| Dividend history | 42 years |
| Last cut or suspension | None |
🗣️ Dividend History
The company’s dividend history reflects a robust commitment to its shareholders, with uninterrupted payouts for over 42 years. This consistency is crucial for investors seeking income reliability. Past dividend actions give insights into the company’s future payout potential.
| Year | Dividend per Share (USD) |
|---|---|
| 2026 | 3.8 |
| 2025 | 7.03 |
| 2024 | 6.37 |
| 2023 | 5.77 |
| 2022 | 5.02 |
📈 Dividend Growth
Monitoring dividend growth is crucial for understanding the company’s future potential to increase shareholder returns. Growth rates over 3 and 5 years provide evidence of how management aligns reinvestment with returns.
| Time | Growth |
|---|---|
| 3 years | 11.88 % |
| 5 years | 14.84 % |
The average dividend growth is 14.84% over 5 years. This shows moderate but steady dividend growth.
📉 Payout Ratio
The payout ratio is an essential metric indicating how much of the company's earnings are being returned to shareholders as dividends. A lower payout ratio can imply a secure dividend with room for growth.
| Key figure | Ratio |
|---|---|
| EPS-based | 24.34 % |
| Free cash flow-based | 23.00 % |
With a 24.34% EPS payout ratio and a 23.00% FCF payout ratio, the dividend appears well covered, allowing flexibility for growth and sustained payments.
✅ Cashflow & Capital Efficiency
Assessing cash flow and capital efficiency helps evaluate a company's ability to sustain operations and finance its dividends. Key ratios highlight inherent operational strengths or weaknesses.
| 2025 | 2024 | 2023 | |
|---|---|---|---|
| Free Cash Flow Yield | 3.73 % | 4.64 % | 5.19 % |
| Earnings Yield | 3.94 % | 4.42 % | 4.16 % |
| CAPEX to Operating Cash Flow | 0.115 | 0.118 | 0.128 |
| Stock-based Compensation to Revenue | 0.80 % | 0.78 % | 0.75 % |
| Free Cash Flow / Operating Cash Flow Ratio | 88.48 % | 88.18 % | 87.22 % |
The company demonstrates strong cash flow generation capability & capital efficiency, crucial for sustaining dividend payouts & reinvestments.
⚠️ Balance Sheet & Leverage Analysis
Understanding the balance sheet structure and leverage provides insights into financial health and risk management strategies, ensuring long-term stability.
| 2025 | 2024 | 2023 | |
|---|---|---|---|
| Debt-to-Equity | 0.705 | 0.909 | 1.257 |
| Debt-to-Assets | 0.327 | 0.375 | 0.433 |
| Debt-to-Capital | 0.413 | 0.476 | 0.557 |
| Net Debt to EBITDA | 1.69 | 2.10 | 3.07 |
| Current Ratio | 1.19 | 0.93 | 0.88 |
| Quick Ratio | 0.706 | 0.549 | 0.508 |
| Financial Leverage | 2.156 | 2.427 | 2.902 |
Parker-Hannifin's leverage metrics are stable, with manageable levels presenting a solid foundation for future operations and expansion.
📈 Fundamental Strength & Profitability
Evaluating fundamental strength identifies the company's ability to generate profit effectively and efficiently with the resources at its disposal.
| 2025 | 2024 | 2023 | |
|---|---|---|---|
| Return on Equity | 25.81 % | 23.56 % | 20.17 % |
| Return on Assets | 11.97 % | 9.71 % | 6.95 % |
| Margins: Net | 17.79 % | 14.27 % | 10.93 % |
| EBIT | 22.75 % | 20.58 % | 17.07 % |
| EBITDA | 27.32 % | 25.23 % | 21.36 % |
| Gross | 36.85 % | 35.91 % | 33.88 % |
| Research & Development to Revenue | 1.21 % | 1.27 % | 1.35 % |
Strong profitability metrics indicate effective management and operational prowess, crucial for long-term value creation.
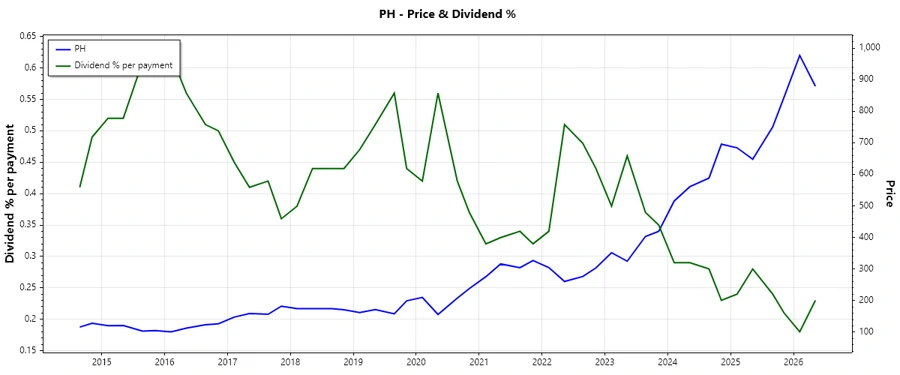
📉 Price Development
Dividend Scoring System
| Category | Score (Out of 5) | Score Bar |
|---|---|---|
| Dividend yield | 3 | |
| Dividend Stability | 5 | |
| Dividend growth | 4 | |
| Payout ratio | 5 | |
| Financial stability | 4 | |
| Dividend continuity | 5 | |
| Cashflow Coverage | 4 | |
| Balance Sheet Quality | 4 |
Total Score: 34/40
Rating
Parker-Hannifin Corporation exhibits a robust dividend profile with a consistent track record, reliable growth potential, and sound financial support. The company is recommended for investors seeking steady income and capital appreciation in the industrial sector.
Smart Data Insight
Master the Perfect Entry & Exit for this Stock
Don't leave your profits to chance. Historically, this stock follows specific seasonal patterns that institutional traders use to maximize returns.
- ✅ Identify the "Golden Buying Window"
- ✅ Avoid high-risk correction cycles
- ✅ Backtested data from the last 20+ years