May 10, 2026 a 02:48 am

📊 Dividend Analysis - Parker-Hannifin Corporation
Parker-Hannifin Corporation is a leading player in the industrial manufacturing sector. With a significant market capitalization, it exhibits a strong presence in its respective industry. The company's commitment to shareholder returns is evident in its long-standing history of dividend payments, showcasing its reliability as a dividend-paying stock.
🗣️ Overview
Parker-Hannifin Corporation operates within the Industrial Manufacturing sector, offering a modest dividend yield of 0.84%. This, combined with a generous current dividend per share of $6.71 USD, reflects positively on its fiscal health. Impressively, the company boasts a dividend payment history spanning 42 years, with no recent suspensions.
| Metric | Value |
|---|---|
| Sector | Industrial Manufacturing |
| Dividend yield | 0.84 % |
| Current dividend per share | $6.71 USD |
| Dividend history | 42 years |
| Last cut or suspension | None |
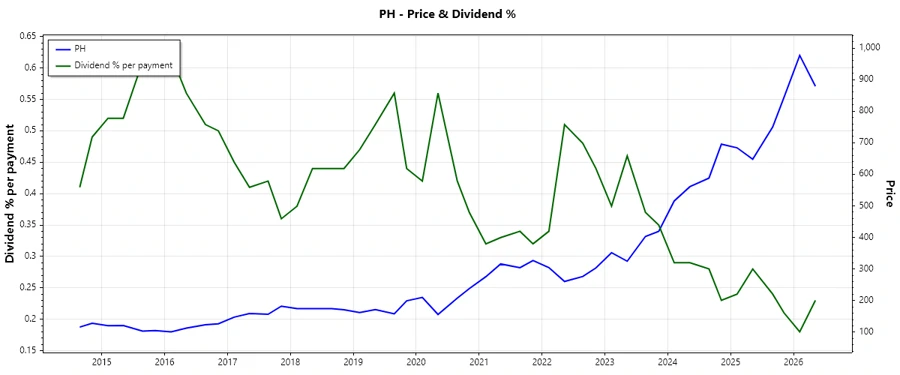
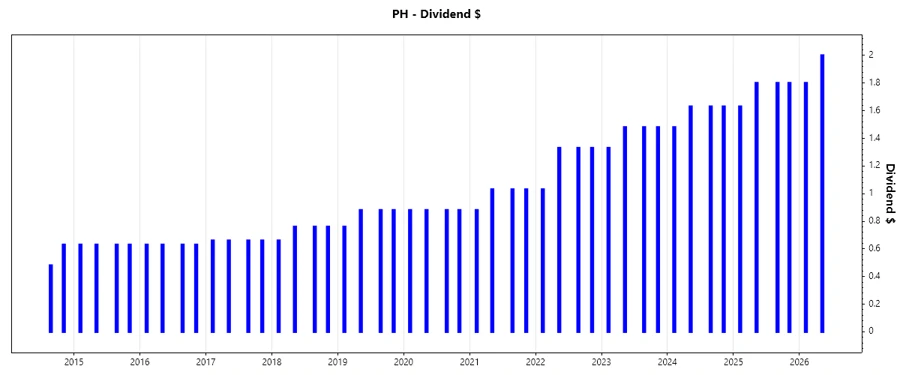
📜 Dividend History
Parker-Hannifin Corporation's dividend history over the years demonstrates its robust financial health and its commitment to returning value to shareholders. Historical data serves as a reassurance of consistent corporate performance.
| Year | Dividend per Share (USD) |
|---|---|
| 2026 | 3.8 |
| 2025 | 7.03 |
| 2024 | 6.37 |
| 2023 | 5.77 |
| 2022 | 5.02 |
📈 Dividend Growth
Analyzing dividend growth is vital as it indicates the potential for increased shareholder returns. Parker-Hannifin's growth metrics present a stable and promising trend.
| Time | Growth |
|---|---|
| 3 years | 11.88 % |
| 5 years | 14.84 % |
The average dividend growth is 14.84 % over 5 years. This shows moderate but steady dividend growth.
🧮 Payout Ratio
Evaluating payout ratios helps determine how much of its earnings the company distributes as dividends. Parker-Hannifin maintains a highly sustainable EPS-based payout ratio of 24.34% and a free cash flow-based payout ratio of 23.00%.
| Key figure | Ratio |
|---|---|
| EPS-based | 24.34 % |
| Free cash flow-based | 23.00 % |
These figures indicate a healthy payout ratio, signifying the room to sustain and potentially increase dividends without compromising financial flexibility.
💰 Cashflow & Capital Efficiency
Parker-Hannifin's cash flow metrics reflect its operational efficiency and ability to fund dividend payments without exorbitant reliance on external financing. Monitoring these ratios over the years provides insights into its financial stability.
| Metric | 2025 | 2024 | 2023 |
|---|---|---|---|
| Free Cash Flow Yield | 3.73% | 4.64% | 5.19% |
| Earnings Yield | 3.94% | 4.42% | 4.16% |
| CAPEX to Operating Cash Flow | 11.52% | 11.82% | 12.78% |
| Stock-based Compensation to Revenue | 0.80% | 0.78% | 0.75% |
| Free Cash Flow / Operating Cash Flow Ratio | 88.48% | 88.18% | 87.22% |
These metrics reinforce Parker-Hannifin's sound cash flow management and capital efficiency, positioning it well for continuous dividend support.
📉 Balance Sheet & Leverage Analysis
A thorough examination of Parker-Hannifin's balance sheet reveals its strategies toward debt management and liquidity provision, highlighting its financial resilience.
| Metric | 2025 | 2024 | 2023 |
|---|---|---|---|
| Debt-to-Equity | 0.70 | 0.91 | 1.26 |
| Debt-to-Assets | 0.33 | 0.37 | 0.43 |
| Debt-to-Capital | 0.41 | 0.48 | 0.56 |
| Net Debt to EBITDA | 1.72 | 2.10 | 3.07 |
| Current Ratio | 1.19 | 0.93 | 0.88 |
| Quick Ratio | 0.71 | 0.55 | 0.51 |
| Financial Leverage | 2.16 | 2.43 | 2.90 |
Through disciplined debt management and strategic leveraging, the company maintains a strong financial position conducive to dividend continuity.
🏆 Fundamental Strength & Profitability
Parker-Hannifin's robust profitability ratios underscore its expertise in converting earnings into sustainable shareholder value.
| Metric | 2025 | 2024 | 2023 |
|---|---|---|---|
| Return on Equity | 25.81% | 23.56% | 20.17% |
| Return on Assets | 11.97% | 9.71% | 6.95% |
| Margins: Net | 17.79% | 14.27% | 10.93% |
| Margins: EBIT | 22.75% | 20.58% | 17.07% |
| Margins: EBITDA | 27.32% | 25.23% | 21.36% |
| Margins: Gross | 36.85% | 35.91% | 33.88% |
| Research & Development to Revenue | 1.21% | 1.27% | 1.35% |
These statistics emphasize the profitability and operational effectiveness central to Parker-Hannifin's strategic objectives.
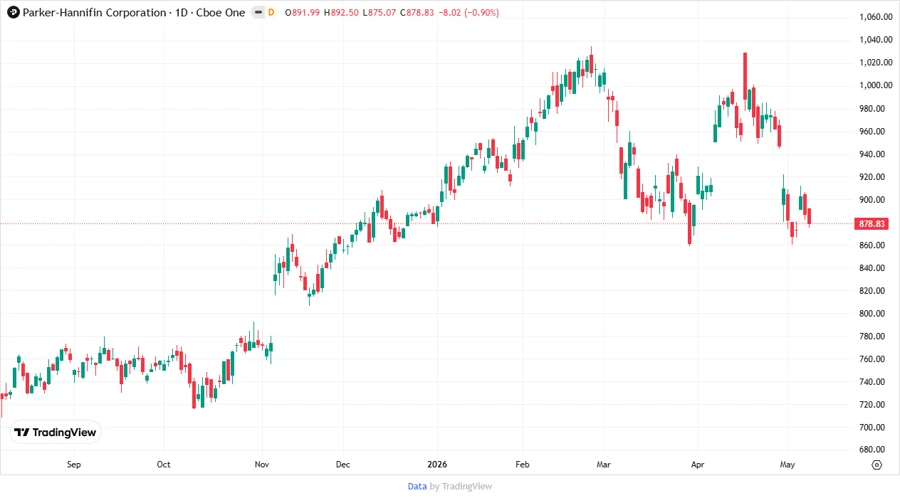
💹 Price Development
🎖️ Dividend Scoring System
| Criteria | Score | Assessment |
|---|---|---|
| Dividend yield | 3 | |
| Dividend Stability | 5 | |
| Dividend growth | 4 | |
| Payout ratio | 5 | |
| Financial stability | 4 | |
| Dividend continuity | 5 | |
| Cashflow Coverage | 4 | |
| Balance Sheet Quality | 4 |
Overall score: 34 out of 40 points
✅ Rating
Parker-Hannifin Corporation demonstrates strong dividend stability and growth, supported by robust financials and operational efficiency. As a reliable dividend-paying entity, it is a commendable option for income-focused investors seeking stable and moderate growth.
Smart Data Insight
Master the Perfect Entry & Exit for this Stock
Don't leave your profits to chance. Historically, this stock follows specific seasonal patterns that institutional traders use to maximize returns.
- ✅ Identify the "Golden Buying Window"
- ✅ Avoid high-risk correction cycles
- ✅ Backtested data from the last 20+ years