December 21, 2025 a 01:15 pm
PHM: Trend and Support & Resistance Analysis - PulteGroup, Inc.
PulteGroup, Inc., a prominent player in the homebuilding industry, exhibits substantial growth potential driven by recent financial performance trends. The technical indicators point towards an overall upward trajectory in the stock price, supported by robust economic conditions within the U.S. housing market. However, caution must be taken with potential interest rate hikes which could impact affordability and demand. Understanding key support and resistance levels will further delineate potential trading opportunities.
Trend Analysis
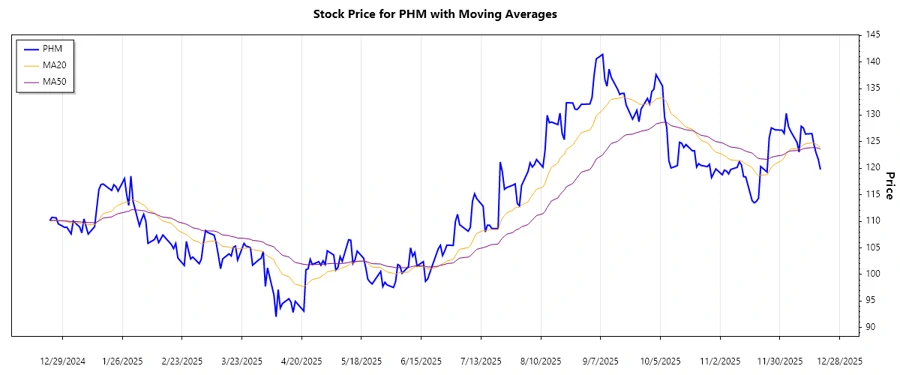
The analysis of the closing prices over the recent months reveals key insights into the trend of PHM stock. Calculating the 20-day and 50-day Exponential Moving Averages (EMA), we have observed the trend direction indicated by the relationship between EMA20 and EMA50. Currently:
| Date | Close Price | Trend |
|---|---|---|
| 2025-12-19 | $119.74 | ▲ |
| 2025-12-18 | $121.66 | ▲ |
| 2025-12-17 | $122.80 | ▲ |
| 2025-12-16 | $124.39 | ▲ |
| 2025-12-15 | $126.51 | ▲ |
| 2025-12-12 | $126.43 | ▲ |
| 2025-12-11 | $127.57 | ▲ |
The upward direction of the trend, indicated by ▲, suggests continued bullish momentum. This can be interpreted as a potential opportunity for long positions.
Support- and Resistance
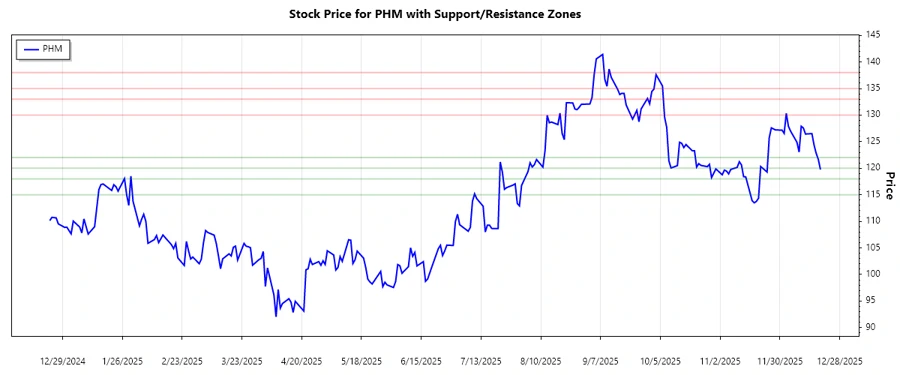
Through careful analysis, we've identified key support and resistance zones that may impact trading decisions:
| Zone Type | Start ($) | End ($) |
|---|---|---|
| Support | 115.00 | 118.00 |
| Support | 120.00 | 122.00 |
| Resistance | 130.00 | 133.00 |
| Resistance | 135.00 | 138.00 |
The current price appears to be within the second support zone, indicating potential buying opportunities if the upward momentum persists.
Conclusion
The PHM stock is currently on an upward trend, as indicated by the EMA calculations and the continuous ▲ trends over the past week. The identification of key support and resistance levels provides crucial insights, enabling careful positioning in light of economic developments in the housing sector. As with any investment, the key risks include changes in market conditions and economic shifts, specifically interest rates and housing demand fluctuations. For analysts, this upward trajectory and strategic zone identification can inform future trading decisions to optimize returns.