November 21, 2025 a 04:44 pm

PHM: Fibonacci Analysis - PulteGroup, Inc.
The PulteGroup Inc. stock (PHM) has demonstrated significant fluctuations over recent months. Analyzing the latest price trends showcases a dominant downward move, impacted by multiple factors, including market volatility and sector-specific challenges. Investors are advised to be cautious about entering new positions, considering external economic elements and internal business strategies. An effective Fibonacci retracement analysis can provide insights into potential support and resistance levels, aiding in informed decision-making.
Fibonacci Analysis
| Aspect | Details |
|---|---|
| Trend Start Date | 2024-12-03 |
| Trend End Date | 2025-11-21 |
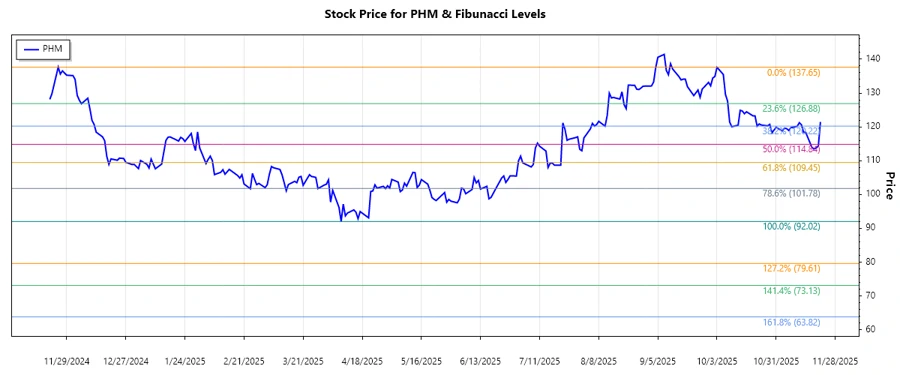
| High Point | $137.65 (2024-11-25) |
| Low Point | $92.02 (2025-04-08) |
| Fibonacci Retracement Levels | |
| 0.236 Level | $104.92 |
| 0.382 Level | $110.71 |
| 0.5 Level | $114.84 |
| 0.618 Level | $118.98 |
| 0.786 Level | $124.04 |
| Current Price Retracement Zone | None (Current Price $121.45) |
| Technical Interpretation | The current price hovers around the 0.618 Fibonacci level, suggesting potential resistance near this point. A breakout could lead to further upward movement, while failure to surpass may signal a retracement towards lower support levels. |
Conclusion
The analysis of PulteGroup Inc.'s stock presents a mixed outlook. The recent decline indicates caution for investors, especially with the current price nearing significant retracement levels. While there is potential for recovery if it surpasses the 0.618 level, failure to break past these thresholds could see the stock facing further declines to previously tested supports. Investors should closely monitor sector conditions and company performance metrics, balancing risks associated with external economic pressures and company-specific developments. The identified levels serve as guideposts for determining entry and exit strategies, reinforcing the importance of adaptive investment approaches.