February 23, 2026 a 07:46 am

PHM: Dividend Analysis - PulteGroup, Inc.
PulteGroup, Inc. demonstrates a solid dividend profile with a long-standing history of 38 years without any recent cuts or suspensions. With a dividend yield of 0.69% and steady growth in dividends over the last 3-5 years, the company appears committed to delivering shareholder returns. The modest payout ratios suggest a sustainable approach to dividend disbursement, supported by its robust financial stability metrics.
Overview 📊
PulteGroup, Inc. operates within the homebuilding sector, offering a modest dividend yield alongside a consistent history of payments. This makes it an attractive option for income-focused investors.
| Sector | Dividend Yield | Current Dividend per Share | Dividend History Years | Last Cut or Suspension |
|---|---|---|---|---|
| Homebuilding | 0.69% | 0.89 USD | 38 years | None |
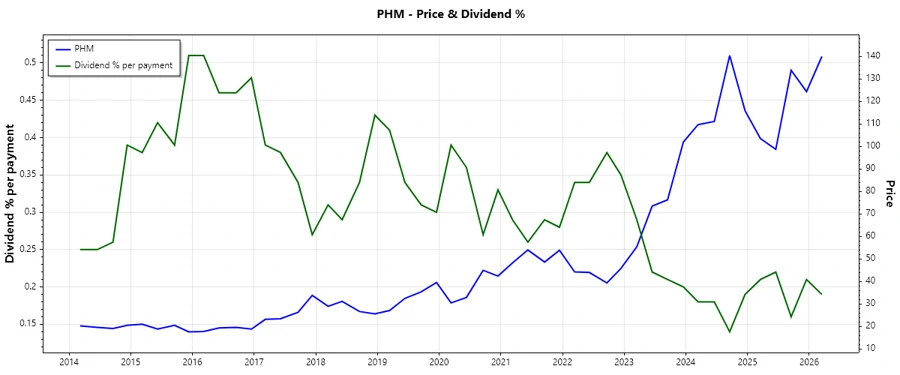
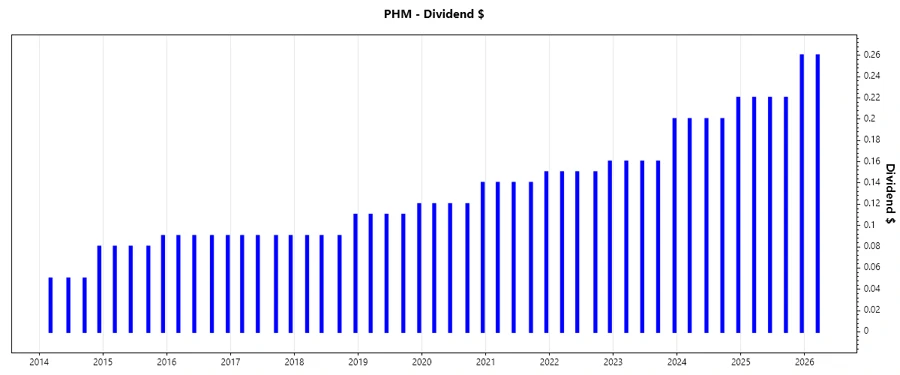
Dividend History 🕰️
The company's rich dividend history illustrates its commitment to shareholder value. A reliable dividend history can serve as a strong indicator of management's dedication to maintaining consistent returns.
| Year | Dividend Per Share |
|---|---|
| 2026 | 0.26 USD |
| 2025 | 0.92 USD |
| 2024 | 0.82 USD |
| 2023 | 0.68 USD |
| 2022 | 0.61 USD |
Dividend Growth 📈
Understanding the growth trajectory of dividends is crucial for long-term investors. The growth rates over recent periods reveal stability in its financial strategies.
| Time | Growth |
|---|---|
| 3 years | 14.68% |
| 5 years | 12.97% |
The average dividend growth is 12.97% over 5 years. This shows moderate but steady dividend growth.
Payout Ratio 💸
Analyzing payout ratios helps assess the sustainability of dividends. Lower payout ratios imply more retained earnings for growth or future payouts.
| Key Figure | Ratio |
|---|---|
| EPS-based | 7.81% |
| Free cash flow-based | 9.82% |
The low EPS payout ratio of 7.81% and FCF payout ratio of 9.82% reflect a conservative and sustainable approach to dividend payments, allowing for growth reinvestment.
Cashflow & Capital Efficiency 💲
Examining cash flows and capital efficiency unveils insights into operational performance and financial health, essential for supporting dividends.
| Metric | 2023 | 2024 | 2025 |
|---|---|---|---|
| Free Cash Flow Yield | 9.27% | 6.89% | 7.53% |
| Earnings Yield | 11.46% | 13.60% | 9.56% |
| CAPEX to Operating Cash Flow | 4.20% | 7.05% | 6.56% |
| Stock-based Compensation to Revenue | 0.30% | 0.30% | 0.32% |
| Free Cash Flow / Operating Cash Flow Ratio | 95.80% | 92.95% | 93.44% |
The consistent and substantial free cash flow yield alongside effective capital management accentuates PulteGroup's effective operational and capital efficiency.
Balance Sheet & Leverage Analysis 📉
The company's capacity to manage debt and maintain liquidity underpins its financial stability, directly impacting dividend safety.
| Metric | 2023 | 2024 | 2025 |
|---|---|---|---|
| Debt-to-Equity | 25.26% | 19.30% | 18.51% |
| Debt-to-Assets | 16.31% | 13.48% | 13.31% |
| Debt-to-Capital | 20.17% | 16.18% | 15.62% |
| Net Debt to EBITDA | 21.92% | 16.75% | 13.04% |
| Current Ratio | 4.87 | 5.72 | 5.91 |
| Quick Ratio | 0.76 | 0.79 | 0.88 |
| Financial Leverage | 1.55 | 1.43 | 1.39 |
PulteGroup maintains a low leverage level with a healthy liquidity position, suggesting a strong ability to meet obligations and support dividend continuance.
Fundamental Strength & Profitability 🛡️
High profitability ratios and efficient capital utilization enable sustainable dividends and bolster investor confidence.
| Metric | 2023 | 2024 | 2025 |
|---|---|---|---|
| Return on Equity | 25.06% | 25.44% | 17.09% |
| Return on Assets | 16.18% | 17.76% | 12.29% |
| Margins: Net, EBIT, EBITDA, Gross | 16.20%, 21.48%, 21.98%, 29.38% | 17.18%, 22.32%, 22.82%, 29.09% | 12.82%, 16.82%, 17.47%, 26.41% |
| R&D to Revenue | 0% | 0% | 0% |
PulteGroup exhibits substantial profitability and efficient asset utilization, indicative of its capacity to maintain competitive dividends.
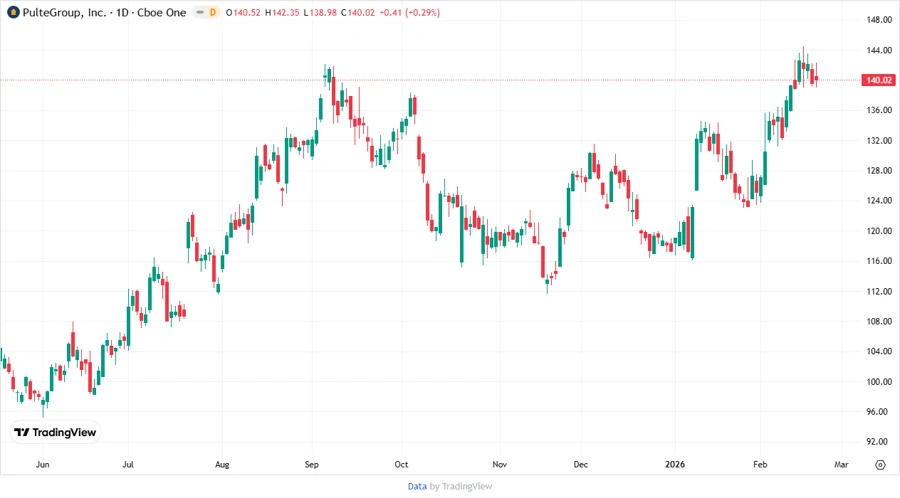
Price Development 📊
Dividend Scoring System ✅
| Criteria | Score | Score Bar |
|---|---|---|
| Dividend yield | 3 | |
| Dividend Stability | 5 | |
| Dividend growth | 4 | |
| Payout ratio | 5 | |
| Financial stability | 5 | |
| Dividend continuity | 5 | |
| Cashflow Coverage | 4 | |
| Balance Sheet Quality | 5 |
Total Score: 36/40
Rating 🗣️
PulteGroup, Inc. demonstrates robust financial health and a strong dividend track record, making it a reliable choice for income investors with a focus on stable, moderate growth. The favorable scoring emphasizes both financial and operational strengths, justifying a strong positive recommendation with cautious optimism about future performance.
Smart Data Insight
Master the Perfect Entry & Exit for this Stock
Don't leave your profits to chance. Historically, this stock follows specific seasonal patterns that institutional traders use to maximize returns.
- ✅ Identify the "Golden Buying Window"
- ✅ Avoid high-risk correction cycles
- ✅ Backtested data from the last 20+ years