January 18, 2026 a 07:46 am
PHM: Dividend Analysis - PulteGroup, Inc.
PulteGroup, Inc. exhibits a commendably consistent dividend history and presents a promising opportunity for income-focused investors. With 37 consecutive years of dividend payments and recent dividend growth, the company's dividend strategy underlines its commitment to shareholders. The comprehensive financial metrics suggest a robust financial health, enhancing its dividend appeal.
📊 Overview
Examining PulteGroup's key metrics provides insights into the company's financial health and its ability to maintain and possibly enhance dividend payouts.
| Metric | Value |
|---|---|
| Sector | Homebuilding |
| Dividend yield | 0.74% |
| Current dividend per share | 0.81 USD |
| Dividend history | 37 years |
| Last cut or suspension | 2013 |
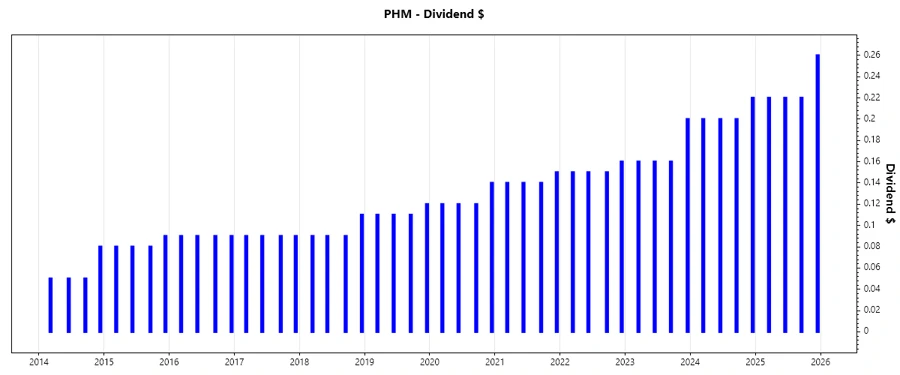
🗣️ Dividend History
PulteGroup's extensive dividend history is a cornerstone of its appeal to income investors, demonstrating resilience and consistency crucial in volatile markets.
| Year | Dividend Per Share (USD) |
|---|---|
| 2025 | 0.92 |
| 2024 | 0.82 |
| 2023 | 0.68 |
| 2022 | 0.61 |
| 2021 | 0.57 |
📈 Dividend Growth
Understanding the dividend growth rate is vital for projecting future income potentials and assessing the company's fiscal prudence and commitment to shareholder returns.
| Time | Growth |
|---|---|
| 3 years | 14.68% |
| 5 years | 12.97% |
The average dividend growth is 12.97% over 5 years. This shows moderate but steady dividend growth.
📉 Payout Ratio
Payout ratios provide insights into how much of earnings and cash flows are consumed by dividends, impacting a company's capacity for reinvestment and growth.
| Key figure | Ratio |
|---|---|
| EPS-based | 6.02% |
| Free cash flow-based | 10.12% |
The EPS payout ratio of 6.02% indicates a conservative approach, showing that PulteGroup retains a substantial portion of its earnings, supporting sustained growth and dividend security. Similarly, the FCF payout ratio of 10.12% reflects healthy coverage.
✅ Cashflow & Capital Efficiency
Evaluating cashflow and capital efficiency is a proxy for understanding a company's operational efficacy and its capacity to invest in growth while maintaining liquidity.
| Metric | 2024 | 2023 | 2022 |
|---|---|---|---|
| Free Cash Flow Yield | 6.89% | 9.27% | 5.19% |
| Earnings Yield | 13.60% | 11.46% | 24.46% |
| CAPEX to Operating Cash Flow | 7.05% | 4.20% | 16.85% |
| Stock-based Compensation to Revenue | 0.33% | 0.30% | 0.27% |
| Free Cash Flow / Operating Cash Flow Ratio | 92.95% | 95.80% | 83.15% |
The cash flow and capital efficiency metrics underscore PulteGroup's robustness in generating consistent cash flows, pivotal for maintaining its dividend policy and facilitating reinvestment.
⚠️ Balance Sheet & Leverage Analysis
Assessing a company's balance sheet and leverage is critical for understanding its financial stability and debt management, affecting its overall risk profile.
| Metric | 2024 | 2023 | 2022 |
|---|---|---|---|
| Debt-to-Equity | 18.60% | 24.59% | 30.54% |
| Debt-to-Assets | 12.98% | 15.87% | 18.40% |
| Debt-to-Capital | 15.68% | 19.74% | 23.39% |
| Net Debt to EBITDA | 0.16x | 0.21x | 0.48x |
| Current Ratio | 11.08 | 9.87 | 8.82 |
| Quick Ratio | 2.62 | 2.30 | 1.74 |
| Financial Leverage | 1.43 | 1.55 | 1.66 |
PulteGroup's balance sheet demonstrates sound financial stability, with low leverage ratios that suggest a prudent management approach in equity and asset utilization, safeguarding against economic downturns.
✅ Fundamental Strength & Profitability
Evaluating fundamental strength and profitability metrics unveils a firm's operational efficiency and capacity to translate revenues into profit, essential for long-term growth prospects.
| Metric | 2024 | 2023 | 2022 |
|---|---|---|---|
| Return on Equity | 25.44% | 25.06% | 29.36% |
| Return on Assets | 17.76% | 16.18% | 17.69% |
| Return on Invested Capital | 18.87% | 17.64% | 19.85% |
| Net Profit Margin | 17.18% | 16.20% | 16.36% |
| EBIT Margin | 22.32% | 21.48% | 21.50% |
| EBITDA Margin | 22.82% | 21.98% | 21.94% |
| Gross Margin | 29.09% | 29.38% | 30.21% |
| Research & Development to Revenue | 0% | 0% | 0% |
The fundamental strength metrics are indicative of PulteGroup's efficiency in capital utilization and maintaining substantial profitability margins, reinforcing its competitive standing.
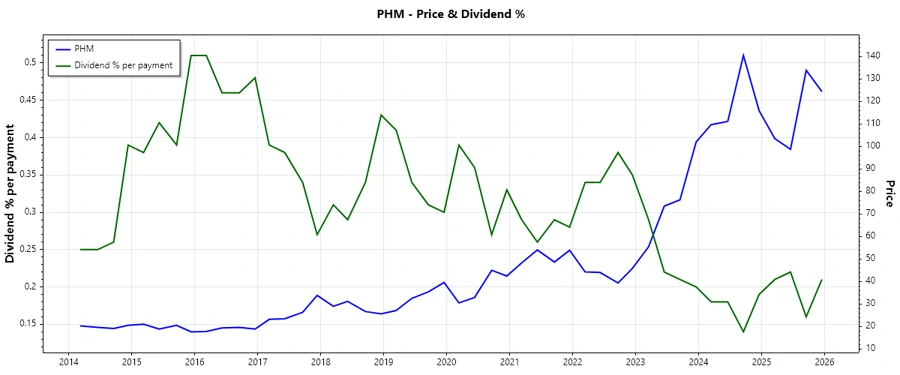
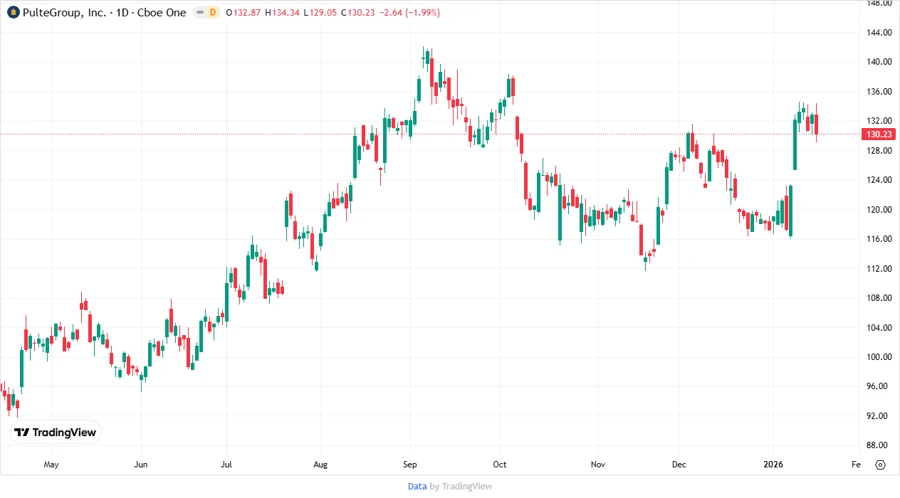
📉 Price Development
Dividend Scoring System
| Criteria | Score | Score Bar |
|---|---|---|
| Dividend yield | 3 | |
| Dividend Stability | 5 | |
| Dividend Growth | 4 | |
| Payout Ratio | 5 | |
| Financial Stability | 5 | |
| Dividend Continuity | 5 | |
| Cashflow Coverage | 4 | |
| Balance Sheet Quality | 5 |
Overall Score: 36 out of 40
Rating
PulteGroup, Inc. offers a compelling dividend-driven investment opportunity, characterized by an outstanding dividend history and solid financial underpinnings. The combination of steady dividend growth, strong balance sheet quality, and efficient operational metrics sanctions a favorable outlook. We recommend a "Buy" for long-term dividend growth investors.