January 06, 2026 a 03:31 am

PHM: Dividend Analysis - PulteGroup, Inc.
PulteGroup, Inc. (PHM) showcases a dynamic dividend profile with a remarkable track record. The company's enduring commitment to maintaining consistent dividend payments is reflected in its impressive dividend history. With a focus on stability and growth, PulteGroup's dividends remain an attractive aspect of its investment appeal.
📊 Overview
PulteGroup, Inc., a prominent player in the residential construction sector, offers a dividend yield of 0.74%. The company's current dividend per share stands at $0.81, underpinned by an extensive 37-year history of dividend payments, which underscores its commitment to rewarding shareholders. Remarkably, there have been no suspensions or cuts since 2013, reflecting resilient financial health.
| Metric | Detail |
|---|---|
| Sector | Residential Construction |
| Dividend Yield | 0.74% |
| Current Dividend Per Share | $0.81 |
| Dividend History | 37 years |
| Last Cut or Suspension | 2013 |
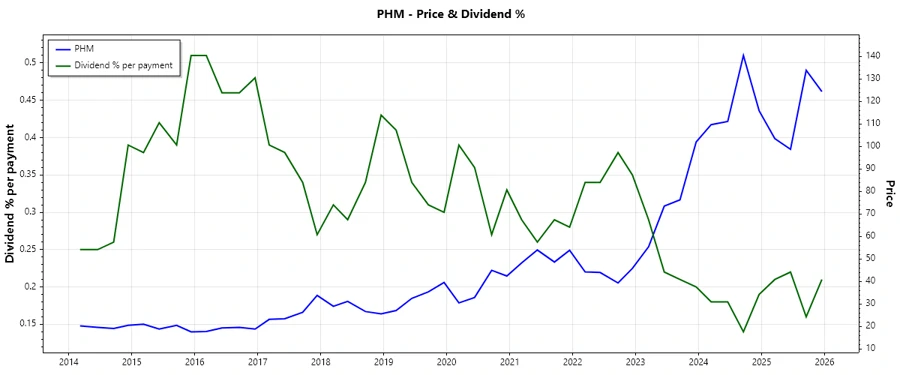
🗣️ Dividend History
The longevity of PulteGroup's dividend history is a testament to its financial stability and strategic allocation of profits. Consistent dividends enhance investor confidence and signify potential for sustainable returns.
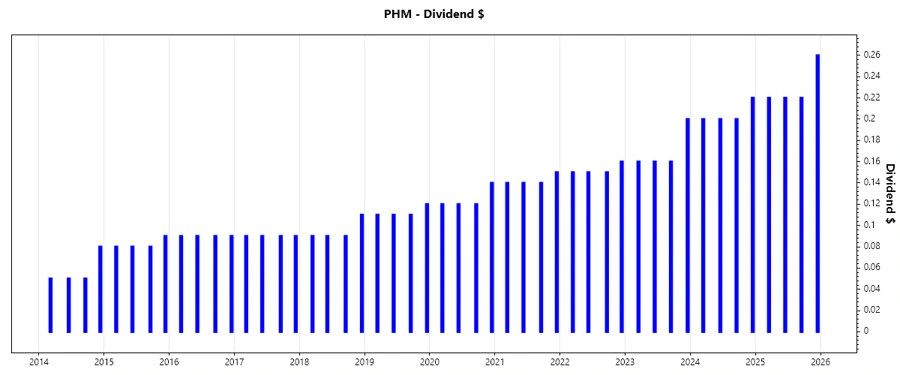
| Year | Dividend Per Share (USD) |
|---|---|
| 2025 | 0.92 |
| 2024 | 0.82 |
| 2023 | 0.68 |
| 2022 | 0.61 |
| 2021 | 0.57 |
📈 Dividend Growth
PulteGroup exhibits robust dividend growth with a 3-year CAGR of 14.68% and a 5-year CAGR of 12.97%. Such growth rates are indicative of a company keen on enhancing shareholder value through incremental enhancements in dividend payouts.
| Time | Growth |
|---|---|
| 3 years | 14.68% |
| 5 years | 12.97% |
The average dividend growth is 12.97% over 5 years. This shows moderate but steady dividend growth.
📉 Payout Ratio
The payout ratio is a critical metric that indicates the sustainability of dividend payments. PulteGroup demonstrates prudent payout management with an EPS-based ratio of 6.02% and a free cash flow-based ratio of 28.87%. These figures suggest significant room for potential dividend increases, ensuring financial flexibility.
| Key Figure | Ratio |
|---|---|
| EPS-based | 6.02% |
| Free Cash Flow-based | 28.87% |
Such low payout ratios indicate that the dividend is well-covered by both earnings and free cash flow, hinting at potential for future dividend growth without sacrificing financial health.
✅ Cashflow & Capital Efficiency
Analyzing cash flow metrics is crucial for assessing the company's ability to sustain and potentially grow its dividends. The company's efficient capital allocation is evidenced by a low CAPEX to operating cash flow ratio of 4.32% and a strong free cash flow to operating cash flow ratio of 92.95%.
| Metric | 2024 | 2023 | 2022 |
|---|---|---|---|
| Free Cash Flow Yield | 6.89% | 9.27% | 5.19% |
| Earnings Yield | 13.60% | 11.46% | 24.46% |
| CAPEX to Operating Cash Flow | 7.05% | 4.20% | 16.85% |
| Stock-based Compensation to Revenue | 0.30% | 0.30% | 0.27% |
| Free Cash Flow / Operating Cash Flow | 92.95% | 95.80% | 83.15% |
These metrics demonstrate robust cash flow management, positioning PulteGroup favorably in terms of capital efficiency and financial resilience.
⚠️ Balance Sheet & Leverage Analysis
The balance sheet and leverage metrics provide insights into the company's financial stability and debt management. PulteGroup maintains a low leverage profile, evidenced by a debt-to-equity ratio of 0.19 and a current ratio of 5.09, indicating strong liquidity and prudent debt management.
| Metric | 2024 | 2023 | 2022 |
|---|---|---|---|
| Debt-to-Equity | 0.19 | 0.21 | 0.25 |
| Debt-to-Assets | 0.13 | 0.14 | 0.15 |
| Debt-to-Capital | 0.16 | 0.17 | 0.20 |
| Net Debt to EBITDA | 0.15 | 0.10 | 0.33 |
| Current Ratio | 5.94 | 6.91 | 6.05 |
| Quick Ratio | 1.39 | 1.60 | 1.18 |
| Financial Leverage | 1.43 | 1.55 | 1.66 |
PulteGroup's ability to maintain a healthy balance sheet with low leverage ratios reflects its sound financial practices and prudent fiscal management.
📊 Fundamental Strength & Profitability
The fundamental strength of PulteGroup is highlighted by its high returns on equity and assets, showcasing effective asset utilization and profitability. Return on equity consistently remains above 21%, underscoring its capacity to generate earnings from shareholder equity.
| Metric | 2024 | 2023 | 2022 |
|---|---|---|---|
| Return on Equity | 25.44% | 25.06% | 29.36% |
| Return on Assets | 17.76% | 16.18% | 17.69% |
| Net Margin | 17.18% | 16.20% | 16.36% |
| EBIT Margin | 22.32% | 21.48% | 21.49% |
| EBITDA Margin | 22.82% | 21.98% | 21.94% |
| Gross Margin | 29.09% | 29.38% | 30.21% |
| R&D to Revenue | 0% | 0% | 0% |
Such strong profitability metrics indicate PulteGroup's solid performance capabilities and competitive advantage within its sector.
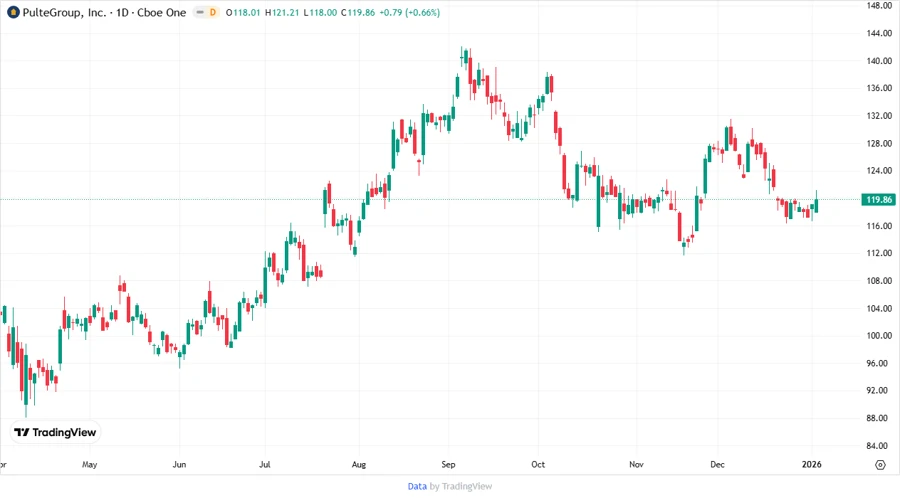
Price Development 📈
Dividend Scoring System 🏆
| Criteria | Score | Score Bar |
|---|---|---|
| Dividend Yield | 3 | |
| Dividend Stability | 5 | |
| Dividend Growth | 4 | |
| Payout Ratio | 5 | |
| Financial Stability | 5 | |
| Dividend Continuity | 5 | |
| Cashflow Coverage | 4 | |
| Balance Sheet Quality | 5 |
Total Score: 36/40
Rating 🎯
PulteGroup, Inc. receives a high dividend score, making it an attractive choice for income-seeking investors. With its steady dividend growth, solid financial fundamentals, and prudent payout ratio, the company is a compelling option for those looking to add a reliable dividend-paying stock to their portfolio.