November 20, 2025 a 03:31 pm


PHM: Dividend Analysis - PulteGroup, Inc.
PulteGroup, Inc., a prominent player in the residential construction sector, showcases a commendable dividend profile with consistent long-term growth. The company's commitment to rewarding shareholders is evident through its established dividend history spanning 37 years without significant interruptions. With a current market capitalization of approximately $22.45 billion and a focus on sustainable dividend payouts, PHM remains an attractive choice for dividend-focused investors.
Overview 📊
PulteGroup, Inc. operates within the housing construction sector, offering a current dividend yield of 0.66% and a dividend per share of $0.81. The company boasts an impressive 37-year dividend history, with no recorded suspensions, highlighting its financial discipline and commitment to shareholder returns.
| Metric | Details |
|---|---|
| Sector | Residential Construction |
| Dividend Yield | 0.657% |
| Current Dividend Per Share | $0.81 USD |
| Dividend History | 37 years |
| Last Cut or Suspension | None |
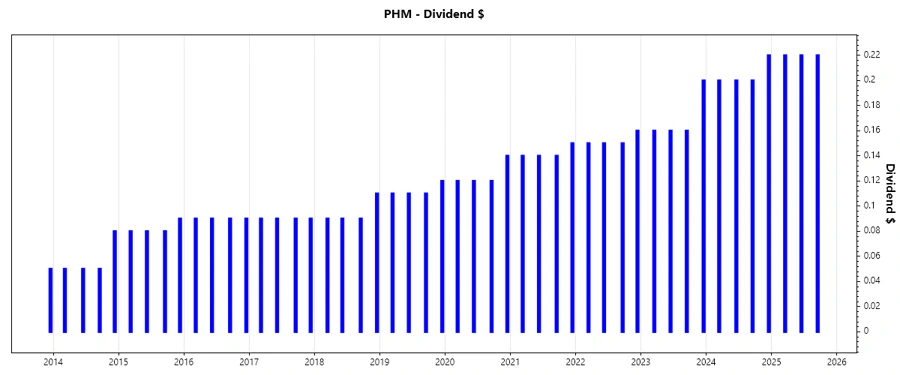
Dividend History 📈
The longevity of PulteGroup's dividend program underscores its financial resilience and management's confidence in the business model. Long-standing dividend histories are indicative of stable earnings and disciplined cash management.
| Year | Dividend Per Share (USD) |
|---|---|
| 2025 | $0.66 |
| 2024 | $0.82 |
| 2023 | $0.68 |
| 2022 | $0.61 |
| 2021 | $0.57 |
Dividend Growth 🔍
Assessing dividend growth is critical for evaluating the incremental earnings retained by shareholders. PulteGroup's consistent increase over the past 3 and 5 years reflects its robust revenue and profit management, while providing increasing income to its investors.
| Time | Growth |
|---|---|
| 3 years | 12.89% |
| 5 years | 12.75% |
The average dividend growth is 12.75% over 5 years. This shows moderate but steady dividend growth.
Payout Ratio 🌟
Payout ratios are essential indicators of dividend sustainability. PulteGroup's payout ratio, based on EPS at 6.02%, and on free cash flow at 28.87%, ensures ample scope for reinvestment while providing steady dividends.
| Key Figure | Ratio |
|---|---|
| EPS-based | 6.02% |
| Free cash flow-based | 28.87% |
With low ratios, PulteGroup possesses a healthy balance between rewarding shareholders and maintaining sufficient capital for operational activities.
Cashflow & Capital Efficiency 💰
Evaluating cashflow metrics and capital efficiency provides insights into the company's capability to fund dividends and investments. Key metrics such as Free Cash Flow Yield and CAPEX vs. Operating Cash Flow indicate effective financial management.
| Metric | 2024 | 2023 | 2022 |
|---|---|---|---|
| Free Cash Flow Yield | 6.89% | 9.27% | 5.19% |
| Earnings Yield | 13.60% | 11.46% | 24.46% |
| CAPEX to Operating Cash Flow | 7.05% | 4.20% | 16.85% |
| Stock-based Compensation to Revenue | 0.30% | 0.30% | 0.27% |
| Free Cash Flow / Operating Cash Flow Ratio | 92.95% | 95.80% | 83.15% |
Collectively, these figures reflect PulteGroup's ability to generate consistent cash flow, ensuring both operational investments and shareholder distributions are well-supported.
Balance Sheet & Leverage Analysis 🔍
The balance sheet strength of a company reflects its financial feasibility. PulteGroup maintains a stable debt profile with a focus on strategic growth management and leverage maintenance.
| Metric | 2024 | 2023 | 2022 |
|---|---|---|---|
| Debt-to-Equity | 18.60% | 20.92% | 24.96% |
| Debt-to-Assets | 12.98% | 13.50% | 15.04% |
| Debt-to-Capital | 15.68% | 17.30% | 19.97% |
| Net Debt to EBITDA | 0.15x | 0.10x | 0.33x |
| Current Ratio | 5.94 | 6.91 | 6.05 |
| Quick Ratio | 1.39 | 1.60 | 1.18 |
| Financial Leverage | 1.43 | 1.55 | 1.66 |
PulteGroup's efficient capital structuring and strong liquidity positions offer confidence in its ability to manage debt and sustain growth.
Fundamental Strength & Profitability 📉
Profitability and fundamental strength are compulsory metrics for evaluating investments. PulteGroup's return metrics indicate sound financial health, showcasing efficient asset management.
| Metric | 2024 | 2023 | 2022 |
|---|---|---|---|
| Return on Equity | 25.44% | 25.06% | 29.36% |
| Return on Assets | 17.76% | 16.18% | 17.69% |
| ROIC | 19.79% | 18.33% | 20.87% |
| Net Profit Margin | 17.18% | 16.20% | 16.36% |
| EBIT Margin | 22.32% | 21.48% | 21.50% |
| EBITDA Margin | 22.82% | 21.98% | 21.94% |
| Gross Margin | 29.09% | 29.38% | 30.21% |
| R&D to Revenue | 0% | 0% | 0% |
Collectively, these margins and ratios support the company's effective operational strategy, reinforcing its profitability across various metrics.
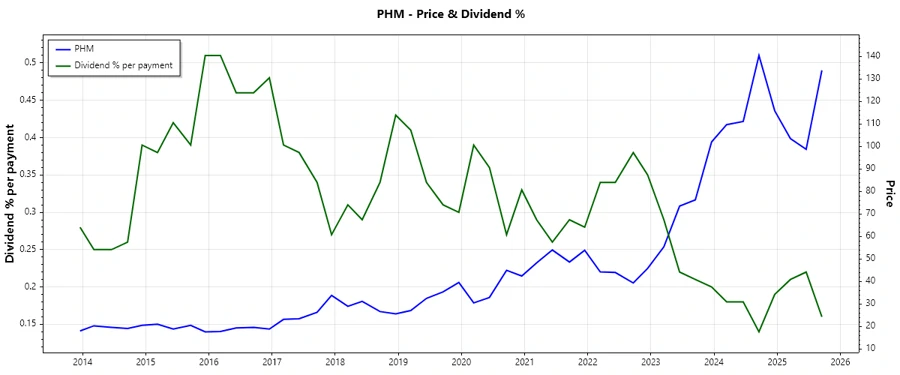
Price Development 💹
Dividend Scoring System ✅
The Dividend Scoring System evaluates fundamental dividend attributes crucial for potential growth and stability in shareholder returns.
| Criteria | Score (1-5) | Score Bar |
|---|---|---|
| Dividend Yield | 3 | |
| Dividend Stability | 5 | |
| Dividend Growth | 4 | |
| Payout Ratio | 5 | |
| Financial Stability | 4 | |
| Dividend Continuity | 5 | |
| Cashflow Coverage | 4 | |
| Balance Sheet Quality | 5 |
Total Score: 35/40
Rating 🗣️
Overall, PulteGroup, Inc. presents a robust dividend profile characterized by a solid history and promising growth prospects. Investors prioritizing dividend security and moderate appreciation potential will find PulteGroup a compelling choice, backed by strong financial health and disciplined cash management.
Smart Data Insight
Master the Perfect Entry & Exit for this Stock
Don't leave your profits to chance. Historically, this stock follows specific seasonal patterns that institutional traders use to maximize returns.
- ✅ Identify the "Golden Buying Window"
- ✅ Avoid high-risk correction cycles
- ✅ Backtested data from the last 20+ years