October 20, 2025 a 12:46 pm

PHM: Dividend Analysis - PulteGroup, Inc.
PulteGroup, Inc. showcases a robust dividend history, with a consistent yield and growth pattern. Despite a moderately low current yield, its commitment to continuous dividend payments spanning decades provides a stable and reliable income stream for investors. The company's financial metrics suggest solid fundamentals supporting its dividend policy.
📊 Overview
PulteGroup, Inc., belonging to the residential construction sector, offers a dividend yield that, while modest at 0.66%, is part of an impressive 37-year dividend history, with a current dividend per share standing at $0.81 USD. Notably, there has been no recent cut or suspension in dividends, emphasizing stability.
| Factor | Details |
|---|---|
| Sector | Residential Construction |
| Dividend yield | 0.66% |
| Current dividend per share | $0.81 USD |
| Dividend history | 37 years |
| Last cut or suspension | None |
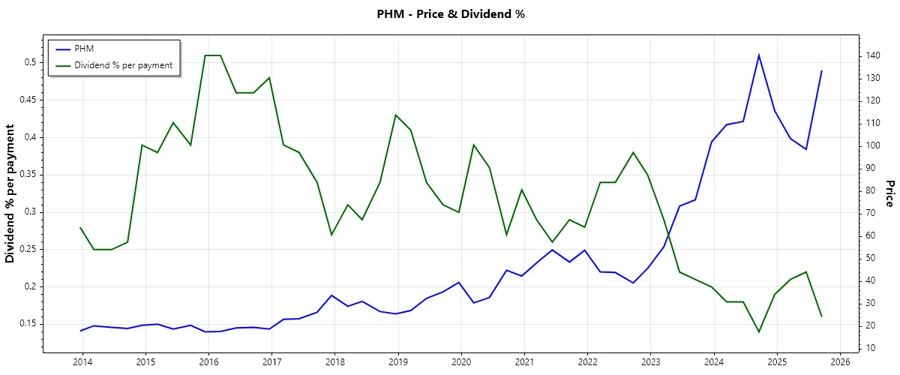
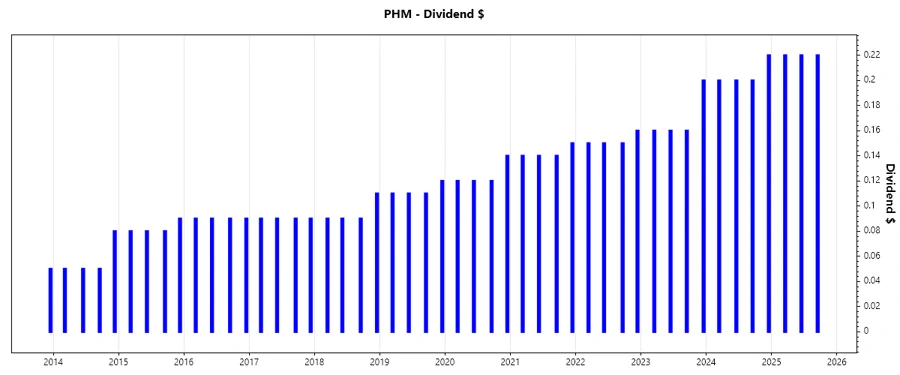
🗣️ Dividend History
Examining the past dividend distributions can offer insights into the company's commitment to returning capital to shareholders. The history reveals a pattern of consistent payments, underscoring financial discipline.
| Year | Dividend Per Share (USD) |
|---|---|
| 2025 | 0.66 |
| 2024 | 0.82 |
| 2023 | 0.68 |
| 2022 | 0.61 |
| 2021 | 0.57 |
📈 Dividend Growth
Tracking the growth rate of dividends is pivotal for assessing a company's financial health and its prospects of maintaining or increasing payouts. Analyzing both short and long-term growth trends offers a comprehensive view.
| Time | Growth |
|---|---|
| 3 years | 12.89% |
| 5 years | 12.75% |
The average dividend growth is 12.75% over 5 years. This shows moderate but steady dividend growth.
📉 Payout Ratio
The payout ratio assesses the sustainability of a company's dividend policy by comparing dividend payouts against its earnings and cash flows. PulteGroup, Inc.'s ratios suggest a conservative dividend policy.
| Key Figure | Ratio |
|---|---|
| EPS-based | 5.85% |
| Free cash flow-based | 12.06% |
The low EPS payout ratio of 5.85% and FCF payout ratio of 12.06% indicate ample room for dividend sustainability and potential growth without jeopardizing financial stability.
🗓️ Cashflow & Capital Efficiency
Analyzing cash flow metrics alongside capital efficiency indicators gives a robust picture of PulteGroup, Inc.'s operational health and its ability to generate shareholder returns while maintaining liquidity.
| Metric | 2024 | 2023 | 2022 |
|---|---|---|---|
| Free Cash Flow Yield | 0.069 | 0.093 | 0.052 |
| Earnings Yield | 0.136 | 0.115 | 0.245 |
| CAPEX to Operating Cash Flow | 0.071 | 0.042 | 0.169 |
| Stock-based Compensation to Revenue | 0.003 | 0.003 | 0.003 |
| Free Cash Flow / Operating Cash Flow Ratio | 0.929 | 0.958 | 0.831 |
The company's ability to sustain capital spending and maintain cash flow yields indicates operational resilience, while the low CAPEX indicates prudent capital allocation.
🏦 Balance Sheet & Leverage Analysis
A comprehensive analysis of leverage ratios and balance sheet strength helps evaluate the financial stability and risk profile of the company.
| Metric | 2024 | 2023 | 2022 |
|---|---|---|---|
| Debt-to-Equity | 0.153 | 0.209 | 0.250 |
| Debt-to-Assets | 0.107 | 0.135 | 0.150 |
| Net Debt to EBITDA | 0.059 | 0.104 | 0.334 |
| Current Ratio | 7.777 | 6.914 | 6.046 |
| Quick Ratio | 1.823 | 1.597 | 1.178 |
With strong liquidity indicated by a high current ratio, PulteGroup, Inc. maintains robust leverage metrics that underline its financial stability and low risk of over-leveraging.
✅ Fundamental Strength & Profitability
PulteGroup, Inc.'s profitability and efficiency ratios are essential metrics to measure its intrinsic value and return-generating capabilities.
| Metric | 2024 | 2023 | 2022 |
|---|---|---|---|
| Return on Equity | 25.44% | 24.97% | 29.36% |
| Net Margin | 17.18% | 16.20% | 16.36% |
| Gross Margin | 29.09% | 29.38% | 30.21% |
| EBIT Margin | 22.32% | 21.48% | 21.50% |
The impressive ROE and stable gross margins highlight PulteGroup, Inc.'s robust profitability framework and its ability to derive substantial returns on equity.
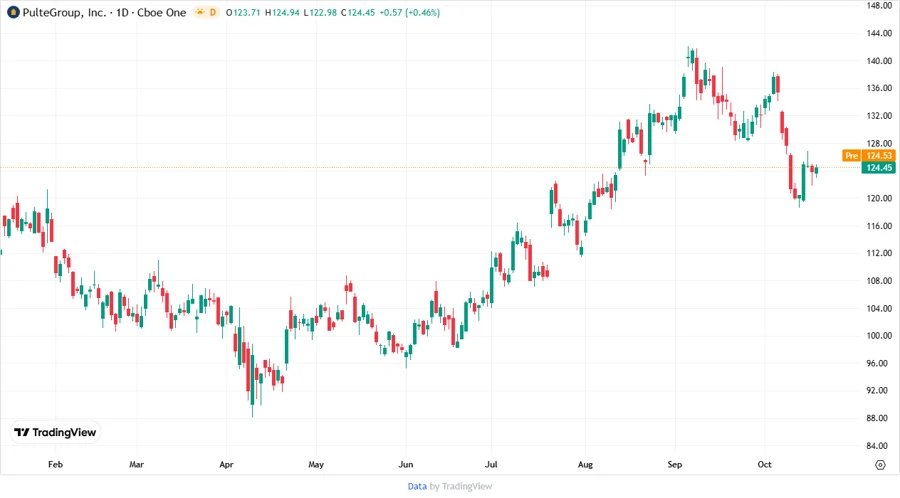
🌟 Price Development
🎯 Dividend Scoring System
| Category | Score | |
|---|---|---|
| Dividend yield | 3 | |
| Dividend Stability | 5 | |
| Dividend growth | 4 | |
| Payout ratio | 5 | |
| Financial stability | 5 | |
| Dividend continuity | 5 | |
| Cashflow Coverage | 5 | |
| Balance Sheet Quality | 5 |
Total Score: 37/40
📑 Rating
PulteGroup, Inc. presents a compelling dividend profile with its remarkable stability and strong financials. The extensive dividend history and conservative payout ratios suggest that it is a reliable dividend-paying entity. The consistent dividend growth and solid leverage metrics warrant a favorable recommendation for income-focused investors seeking steady returns.
Smart Data Insight
Master the Perfect Entry & Exit for this Stock
Don't leave your profits to chance. Historically, this stock follows specific seasonal patterns that institutional traders use to maximize returns.
- ✅ Identify the "Golden Buying Window"
- ✅ Avoid high-risk correction cycles
- ✅ Backtested data from the last 20+ years