September 19, 2025 a 03:15 am

PG: Trend and Support & Resistance Analysis - The Procter & Gamble Company
The Procter & Gamble Company (PG) stock has shown mixed signals in recent months, influenced by global market trends and company-specific factors. With its diverse product line and strong market position, PG continues to demonstrate resilience. However, analyzing the recent price patterns is crucial for understanding the potential market direction. Despite some market fluctuations, the stock remains a staple for investors focused on consumer goods.
Trend Analysis
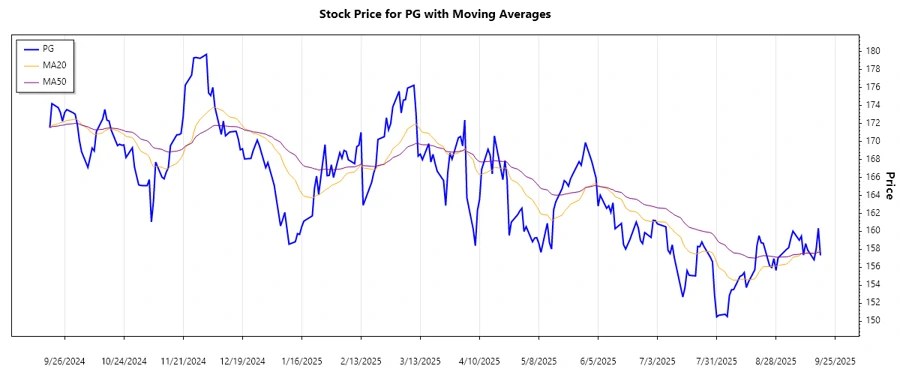
Upon examining the historical trading data, The Procter & Gamble Company stock exhibits fluctuating patterns suggesting varying levels of momentum. Calculating the Exponential Moving Averages, EMA20 is 157.95 and EMA50 is 158.34. This indicates a current ▼ Abwärtstrend as EMA20 < EMA50.
| Date | Close Price | Trend |
|---|---|---|
| 2025-09-18 | 157.32 | ▼ |
| 2025-09-17 | 160.33 | ▼ |
| 2025-09-16 | 158.05 | ▼ |
| 2025-09-15 | 156.83 | ▼ |
| 2025-09-12 | 157.90 | ▼ |
| 2025-09-11 | 158.63 | ▲ |
| 2025-09-10 | 157.35 | ▼ |
Technically, the current downward trend suggests investor caution as price consolidations continue around key moving averages.
Support and Resistance
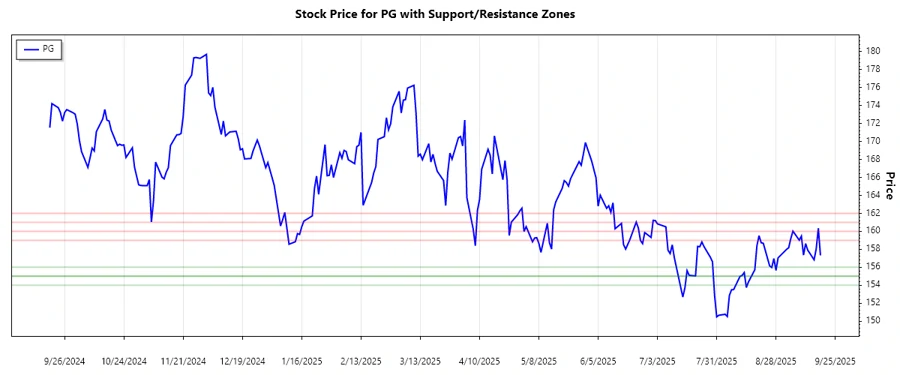
Using technical methods, current support and resistance zones have been established to better understand PG's market behavior. The current calculated zones are:
| Zone Type | Zone Range |
|---|---|
| Support 1 | 155.00 - 156.00 |
| Support 2 | 154.00 - 155.00 |
| Resistance 1 | 159.00 - 160.00 |
| Resistance 2 | 161.00 - 162.00 |
The current stock price is fluctuating near the upper range of the support zone, indicating potential room for upward movement if resistance levels are broken.
Conclusion
Overall, The Procter & Gamble Company sustains a strong market position with resilient performance in its sector. Despite the current downward trend, critical support zones suggest firm investor interest. Breaking through resistance levels could assert bullish sentiment, while maintaining below could continue current trends. Market dynamics call for vigilance by investors assessing risk and opportunity in PG as stability within its operational markets remains key.
Smart Data Insight
Master the Perfect Entry & Exit for this Stock
Don't leave your profits to chance. Historically, this stock follows specific seasonal patterns that institutional traders use to maximize returns.
- ✅ Identify the "Golden Buying Window"
- ✅ Avoid high-risk correction cycles
- ✅ Backtested data from the last 20+ years