August 06, 2025 a 02:03 pm

PG: Trend and Support & Resistance Analysis - The Procter & Gamble Company
The Procter & Gamble Company, a leader in the consumer packaged goods industry, has demonstrated substantial resilience and adaptability in changing market dynamics. With a diversified product portfolio, PG continues to leverage its extensive global reach. However, the technical trends need cautious evaluation. This analysis explores the stock's recent trends, support, and resistance levels.
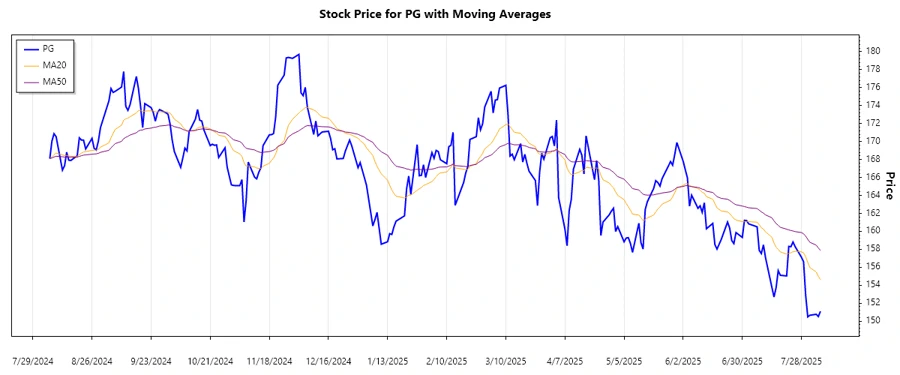
Trend Analysis
The stock has exhibited fluctuations in recent months. The Exponential Moving Averages (EMAs) offer insights:
| Date | Close Price | Trend |
|---|---|---|
| 2025-08-06 | 151.09 | ▼ |
| 2025-08-05 | 150.51 | ▼ |
| 2025-08-04 | 150.76 | ▼ |
| 2025-08-01 | 150.65 | ▼ |
| 2025-07-31 | 150.47 | ▼ |
| 2025-07-30 | 152.88 | ▲ |
| 2025-07-29 | 156.61 | ▲ |
Over the recent period, the EMA20 < EMA50, indicating a downward trend. This suggests sellers have taken control.
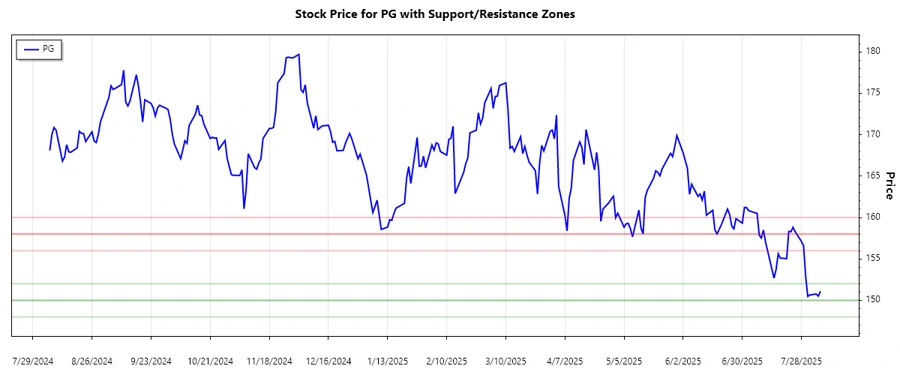
Support and Resistance
Key levels to watch:
| Zone Type | From | To |
|---|---|---|
| Support | 150.00 | 152.00 |
| Support | 148.00 | 150.00 |
| Resistance | 156.00 | 158.00 |
| Resistance | 158.00 | 160.00 |
The current price is near the lower support zone, suggesting a potential bounce or further decline.
Technically, the stock's position at support levels could signal either a rebound opportunity or risk of further decline if breached.
Conclusion
The Procter & Gamble stock shows a short-term bearish trend, noted by the EMA analysis. As it nears support levels, it presents both potential opportunity and risk. Investors should watch for any signals of trend reversal, especially if market fundamentals align. This technical analysis underscores the importance of monitoring key support and resistance levels closely to inform trading decisions.
Smart Data Insight
Master the Perfect Entry & Exit for this Stock
Don't leave your profits to chance. Historically, this stock follows specific seasonal patterns that institutional traders use to maximize returns.
- ✅ Identify the "Golden Buying Window"
- ✅ Avoid high-risk correction cycles
- ✅ Backtested data from the last 20+ years