April 30, 2026 a 01:00 pm

PG: Fundamental Ratio Analysis - The Procter & Gamble Company
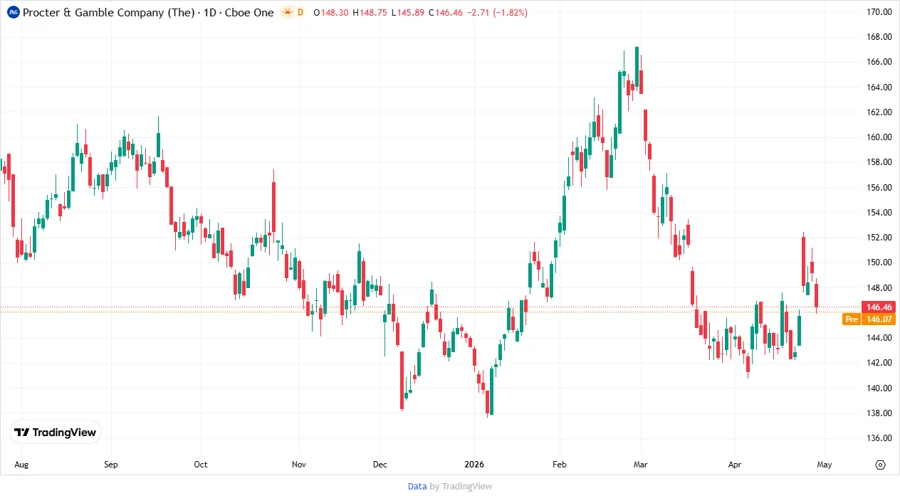
The Procter & Gamble Company (Ticker: PG) demonstrates steady performance in the consumer goods sector. The company's diverse product categories have shown resilience in volatile markets. PG's stock remains attractive to investors seeking stability and moderate growth.
Fundamentals Rating
The Procter & Gamble Company has a solid B+ rating, reflecting strong returns on equity and assets despite a weaker debt-to-equity ratio.
| Category | Score | Visualization |
|---|---|---|
| Discounted Cash Flow | 4 | |
| Return on Equity | 5 | |
| Return on Assets | 5 | |
| Debt to Equity | 1 | |
| Price to Earnings | 3 | |
| Price to Book | 1 |
Historical Rating
Recent historical data point to consistent scoring across key performance indicators, reflecting stable operations over time.
| Date | Overall | DCF | ROE | ROA |
|---|---|---|---|---|
| 2026-04-29 | 3 | 4 | 5 | 5 |
| Previous | 0 | 4 | 5 | 5 |
Analyst Price Targets
Analysts project a positive outlook, with a consensus rating of 'Buy' and price targets highlighting potential for growth.
| High | Low | Median | Consensus |
|---|---|---|---|
| $179 | $142 | $163.5 | $161.88 |
Analyst Sentiment
Analyst sentiment remains bullish, with a majority recommending 'Buy'. The distribution of recommendations reflects confidence in PG's market strategies.
| Recommendation | Count | Visualization |
|---|---|---|
| Strong Buy | 0 | |
| Buy | 28 | |
| Hold | 23 | |
| Sell | 1 | |
| Strong Sell | 0 |
Conclusion
The Procter & Gamble Company exhibits impressive financial metrics with high scores in returns on assets and equity. Despite concerns about its debt-to-equity ratio, PG's diversified product range and consistent market demand ensure competitive positioning. Analyst recommendations and price targets suggest moderate upward potential. Investors looking for stable and resilient performance might find PG appealing in a defensive portfolio. However, monitoring debt levels will be crucial to mitigate potential risks.
Smart Data Insight
Master the Perfect Entry & Exit for this Stock
Don't leave your profits to chance. Historically, this stock follows specific seasonal patterns that institutional traders use to maximize returns.
- ✅ Identify the "Golden Buying Window"
- ✅ Avoid high-risk correction cycles
- ✅ Backtested data from the last 20+ years