
July 10, 2026 a 04:44 pm
PG: Fibonacci Analysis - The Procter & Gamble Company
The Procter & Gamble Company (P&G) stock has demonstrated a rather resilient performance amidst fluctuating market conditions. Its diverse product portfolio across consumer goods segments positions P&G favorably in times of economic uncertainty. Investors should, however, weigh potential risks such as currency fluctuations and increased competitive pressures in the consumer goods market.
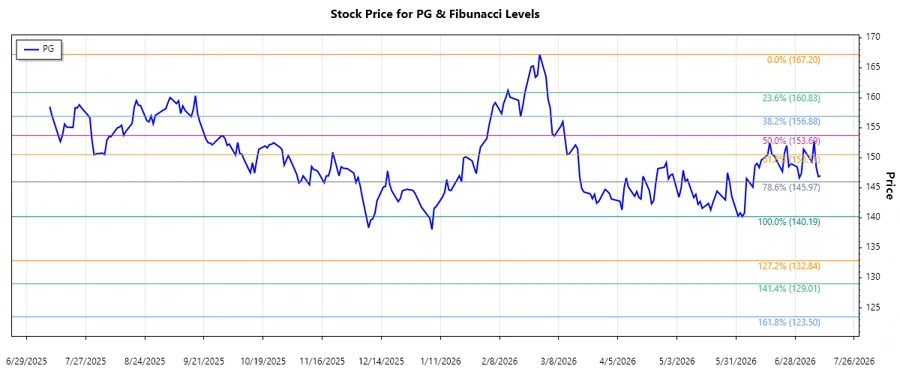
Fibonacci Analysis
| Detail | Value |
|---|---|
| Trend Type | Downtrend |
| Start Date | 2026-02-27 |
| End Date | 2026-07-10 |
| High Price | 167.20 (2026-02-27) |
| Low Price | 140.19 (2026-06-03) |
| Fibonacci 0.236 | 147.87 |
| Fibonacci 0.382 | 151.03 |
| Fibonacci 0.5 | 153.695 |
| Fibonacci 0.618 | 156.36 |
| Fibonacci 0.786 | 160.33 |
| Current Price | 146.98 |
| Retracement Zone | None |
| Interpretation | The current price is below all key Fibonacci levels. This suggests that the stock is still downward trending, and investors may look for possible support near the 140.19 mark. |
Conclusion
The Procter & Gamble Company is currently in a bearish phase, with its stock price not yet reclaiming significant Fibonacci levels. This suggests continued caution for investors considering positions in P&G. While the broad product portfolio provides resilience, market volatility remains a concern. The technical outlook suggests monitoring for strong support, potentially around the June low, before making significant investment decisions. As the company navigates challenging economic landscapes, investors should stay informed on both macroeconomic factors and company-specific developments to better position their strategies.
Smart Data Insight
Master the Perfect Entry & Exit for this Stock
Don't leave your profits to chance. Historically, this stock follows specific seasonal patterns that institutional traders use to maximize returns.
- ✅ Identify the "Golden Buying Window"
- ✅ Avoid high-risk correction cycles
- ✅ Backtested data from the last 20+ years