
July 21, 2026 a 03:31 pm
PG: Dividend Analysis - The Procter & Gamble Company
The Procter & Gamble Company (PG) is a well-established leader in the consumer goods sector, boasting an impressive market capitalization of approximately USD 344 billion. Known for its robust dividend history of 57 years without any recent cuts, PG offers a stable and attractive dividend yield. Despite a challenging macroeconomic environment, the company’s prudent financial management ensures sustainability and continued dividend growth. This analysis explores PG’s dividend attributes, cash flow dynamics, and overarching financial health.
📊 Overview
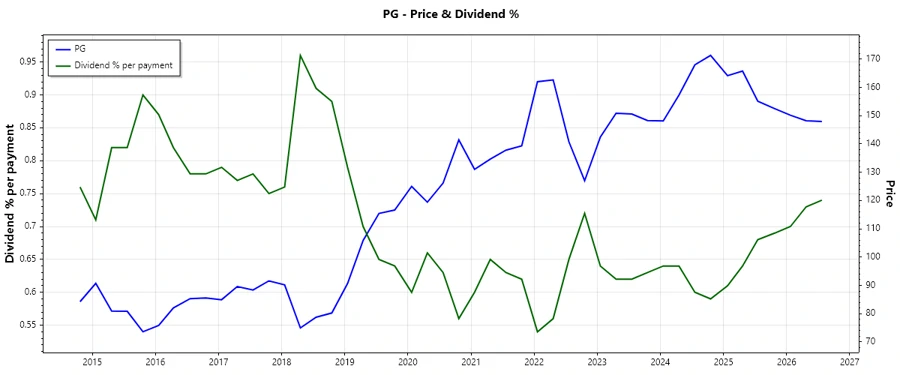
Procter & Gamble operates in the Consumer Goods sector, known for its consistency and resilience. The company exhibits a strong dividend yield of 2.91%, with a current annual dividend of $4.02 per share. With a 57-year history of uninterrupted dividend payments, PG exemplifies a commitment to returning value to shareholders. The absence of recent cuts or suspensions further underscores this reliability.
| Metric | Value |
|---|---|
| Sector | Consumer Goods |
| Dividend Yield | 2.91% |
| Current Dividend Per Share | $4.02 |
| Dividend History | 57 years |
| Last Cut or Suspension | None |
🗣️ Dividend History
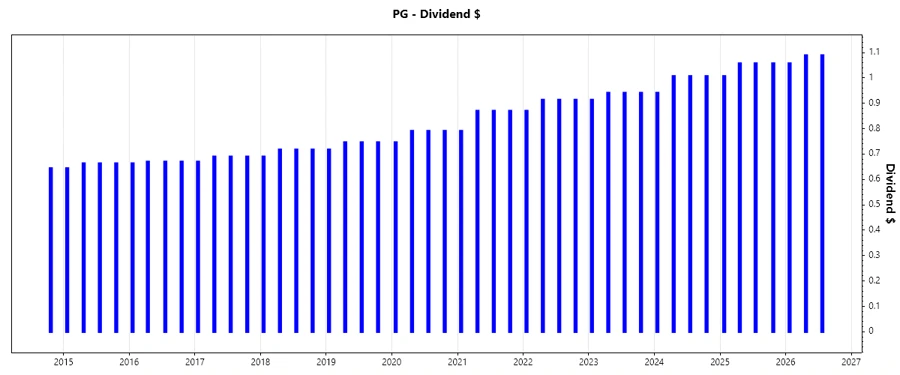
The strength of a company’s dividend history reflects its financial discipline and commitment to shareholders. Procter & Gamble’s uninterrupted dividend payments over the past 57 years highlight its robust capital allocation strategy and predictable cash flow generation.
| Year | Dividend Per Share (USD) |
|---|---|
| 2026 | 3.23 |
| 2025 | 4.18 |
| 2024 | 3.96 |
| 2023 | 3.74 |
| 2022 | 3.61 |
📈 Dividend Growth
The dividend growth rate is an important indicator of how effectively a company is increasing returns to shareholders. Procter & Gamble’s 3-year and 5-year dividend growth rates stand at 4.99% and 6.02%, respectively. These figures demonstrate that PG is steadily increasing its payouts, reflecting confidence in its earnings and cash flow prospects.
| Time | Growth |
|---|---|
| 3 years | 4.99% |
| 5 years | 6.02% |
The average dividend growth is 6.02% over 5 years. This shows moderate but steady dividend growth.
📉 Payout Ratio
The payout ratio measures what proportion of earnings a company pays out as dividends, which is crucial for assessing dividend safety and sustainability. Procter & Gamble demonstrates a moderate EPS-based payout ratio of 58.32% and an FCF payout ratio of 62.32%. These figures suggest that PG maintains a balanced distribution, retaining a significant portion of earnings to reinvest in growth or buffer against earnings volatility.
| Key Figure | Ratio |
|---|---|
| EPS-based | 58.32% |
| Free cash flow-based | 62.32% |
✅ Cashflow & Capital Efficiency
Cash flow generation and capital efficiency are critical for supporting dividend policies. Procter & Gamble’s free cash flow yield and earnings yield indicators illustrate the company's capacity to generate cash beyond its investment needs. The company’s CAPEX to Operating Cash Flow and Stock-based Compensation to Revenue ratios reflect an efficient allocation of capital. The consistent Free Cash Flow / Operating Cash Flow Ratio highlights PG’s robust cash conversion ability.
| Year | 2025 | 2024 | 2023 |
|---|---|---|---|
| Free Cash Flow Yield | 3.59% | 4.30% | 3.84% |
| Earnings Yield | 4.09% | 3.87% | 4.08% |
| CAPEX to Operating Cash Flow | 21.18% | 16.74% | 18.17% |
| Stock-based Compensation to Revenue | 0.56% | 0.67% | 0.66% |
| Free Cash Flow / Operating Cash Flow Ratio | 78.82% | 83.26% | 81.83% |
⚠️ Balance Sheet & Leverage Analysis
Procter & Gamble's balance sheet strength is evidenced by its leverage ratios. With a debt-to-equity ratio of 0.68 and a net debt to EBITDA ratio of under 1, the company maintains reasonable leverage levels while ensuring liquidity with a current ratio of 0.73. The company’s quick ratio of 0.49 and solvent profile emphasize financial resilience amid changing economic conditions.
| Metric | 2025 | 2024 | 2023 |
|---|---|---|---|
| Debt-to-Equity | 68.18% | 66.36% | 75.73% |
| Debt-to-Assets | 28.32% | 27.27% | 29.32% |
| Debt-to-Capital | 40.54% | 39.89% | 43.09% |
| Net Debt to EBITDA | 0.99 | 1.06 | 1.25 |
| Current Ratio | 0.71 | 0.73 | 0.63 |
| Quick Ratio | 0.49 | 0.53 | 0.44 |
| Financial Leverage | 2.41 | 2.43 | 2.58 |
Fundamental Strength & Profitability
Procter & Gamble’s profitability metrics illustrate its fundamental resilience. With a healthy return on equity (ROE) of 31.32% and a return on assets (ROA) of 12.13%, PG efficiently allocates shareholder funds. The company’s gross and net profit margins underline its operational effectiveness and strategic capability to maintain profitability amidst competitive pressures.
| Year | 2025 | 2024 | 2023 |
|---|---|---|---|
| Return on Equity | 30.71% | 29.59% | 31.33% |
| Return on Assets | 12.76% | 12.16% | 12.13% |
| Net Margin | 18.95% | 17.70% | 17.87% |
| EBIT Margin | 25.00% | 23.42% | 23.30% |
| EBITDA Margin | 28.38% | 26.87% | 26.55% |
| Gross Margin | 51.16% | 51.39% | 47.86% |
| Research & Development to Revenue | 0.00% | 0.00% | 0.00% |
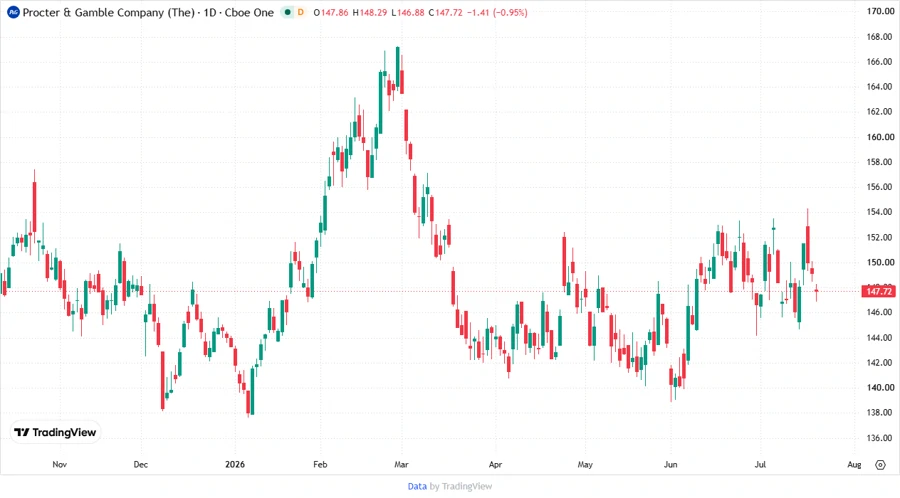
📊 Price Development
Dividend Scoring System
The Dividend Scoring System assesses key factors affecting Procter & Gamble’s dividend health. This simple but effective model gauges the stability, growth, and sustainability of dividends, resulting in a comprehensive score that highlights investment attractiveness.
| Category | Score | Score Bar |
|---|---|---|
| Dividend Yield | 4 | |
| Dividend Stability | 5 | |
| Dividend Growth | 4 | |
| Payout Ratio | 4 | |
| Financial Stability | 4 | |
| Dividend Continuity | 5 | |
| Cashflow Coverage | 4 | |
| Balance Sheet Quality | 4 |
Overall Score: 34/40
Rating
Overall, The Procter & Gamble Company's dividend profile is exceptional. With a robust history, steady growth, and sound financial fundamentals, the stock represents a solid choice for income-focused investors looking for stability and moderate growth. The comprehensive dividend scoring system underscores PG’s suitability as a resilient dividend investment.
Smart Data Insight
Master the Perfect Entry & Exit for this Stock
Don't leave your profits to chance. Historically, this stock follows specific seasonal patterns that institutional traders use to maximize returns.
- ✅ Identify the "Golden Buying Window"
- ✅ Avoid high-risk correction cycles
- ✅ Backtested data from the last 20+ years