December 11, 2025 a 07:46 am

📊 PG: Dividend Analysis - The Procter & Gamble Company
The Procter & Gamble Company, a stalwart in the consumer goods sector, is renowned for its consistent dividend payments spanning over half a century. Its financial stability combined with a strategic focus on innovation solidifies its position as a leader with attractive yields for dividend investors.
🗣️ Overview
Procter & Gamble is a formidable entity in the market, recognized for its robust dividend yield which currently stands at 2.74%. Backed by a steadfast history of 56 years of consecutive dividend payments, the company's last dividend cut occurred in 2003, reflecting a strong commitment to returning capital to shareholders.
| Metric | Details |
|---|---|
| Sector | Consumer Goods |
| Dividend Yield | 2.74% |
| Current Dividend Per Share | 4.02 USD |
| Dividend History | 56 years |
| Last Cut or Suspension | 2003 |
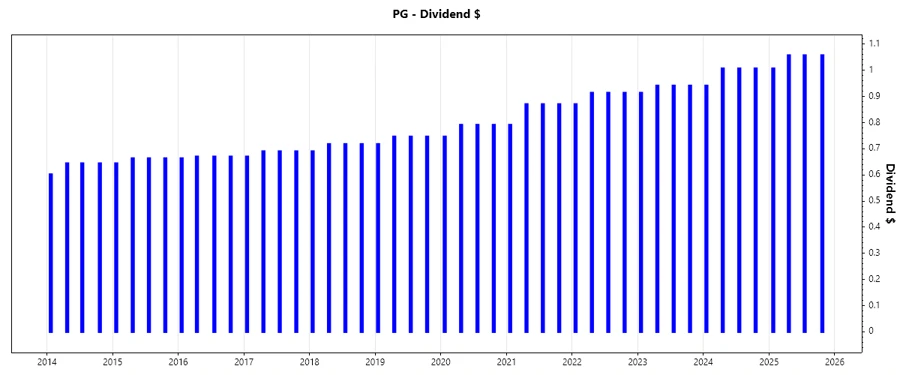
📈 Dividend History
The extensive history of Procter & Gamble's dividend payments highlights its dedication to returning value to shareholders. An examination of its past dividends provides insights into the company's growth potential and financial health, making it a crucial indicator for potential investors.
| Year | Dividend Per Share (USD) |
|---|---|
| 2025 | 4.18 |
| 2024 | 3.96 |
| 2023 | 3.74 |
| 2022 | 3.61 |
| 2021 | 3.40 |
📉 Dividend Growth
Dividend growth is a critical factor for assessing the company's capacity to not only maintain but increase dividend payouts. The progression over three and five years is indicative of the company's sustainable growth strategy.
| Time | Growth |
|---|---|
| 3 years | 5.21% |
| 5 years | 6.03% |
The average dividend growth is 6.03% over 5 years. This shows moderate but steady dividend growth.
✅ Payout Ratio
A crucial indicator of dividend sustainability, the payout ratio provides an understanding of the proportion of earnings and cash flow returned to shareholders in the form of dividends. A balance is essential to ensure dividends are sustainable.
| Key figure | Ratio |
|---|---|
| EPS-based | 58.46% |
| Free cash flow-based | 62.90% |
The EPS-based payout ratio of 58.46% and FCF-based ratio of 62.90% are reasonable, indicating a well-managed balance between rewarding shareholders and retaining capital for growth.
📊 Cashflow & Capital Efficiency
The company’s cash flow management and capital efficiency ratios are pivotal in understanding its operational sustainability and return on investment. Key metrics provide insights into financial health.
| Year | 2023 | 2024 | 2025 |
|---|---|---|---|
| Free Cash Flow Yield | 3.84% | 4.30% | 3.59% |
| Earnings Yield | 4.08% | 3.87% | 4.09% |
| CAPEX to Operating Cash Flow | 18.17% | 16.74% | 21.18% |
| Stock-based Compensation to Revenue | 0.67% | 0.67% | 0.56% |
| Free Cash Flow / Operating Cash Flow Ratio | 81.83% | 83.26% | 78.82% |
The company's strong cash flow ratios and CAPEX management demonstrate effective capital allocation, enhancing its ability to sustain operations and dividend payments.
💼 Balance Sheet & Leverage Analysis
Evaluating the balance sheet provides insights into the company's debt management and liquidity. Key metrics indicate the risk of financial distress and the ability to meet obligations.
| Year | 2023 | 2024 | 2025 |
|---|---|---|---|
| Debt-to-Equity | 75.73% | 66.36% | 68.18% |
| Debt-to-Assets | 29.32% | 27.27% | 28.32% |
| Debt-to-Capital | 43.09% | 39.89% | 40.54% |
| Net Debt to EBITDA | 1.25 | 1.06 | 1.08 |
| Current Ratio | 0.63 | 0.73 | 0.71 |
| Quick Ratio | 0.44 | 0.53 | 0.49 |
| Financial Leverage | 2.58 | 2.43 | 2.41 |
Procter & Gamble maintains prudent leverage with manageable debt levels, showcasing financial robustness and capacity to handle obligations effectively.
💡 Fundamental Strength & Profitability
The analysis of key profitability ratios and return metrics offers valuable insights into the firm’s general health and competitive advantage within the industry.
| Year | 2023 | 2024 | 2025 |
|---|---|---|---|
| Return on Equity | 31.33% | 29.59% | 30.71% |
| Return on Assets | 12.13% | 12.16% | 12.76% |
| Margins: Net | 17.87% | 17.70% | 18.95% |
| EBIT Margin | 23.30% | 23.42% | 25.00% |
| EBITDA Margin | 26.55% | 26.87% | 28.38% |
| Gross Margin | 47.86% | 51.39% | 51.16% |
| R&D to Revenue | 0.00% | 0.00% | 2.49% |
Procter & Gamble's impressive profitability metrics and ROI affirm its strong market position and potential for continued capacity to generate shareholder value.
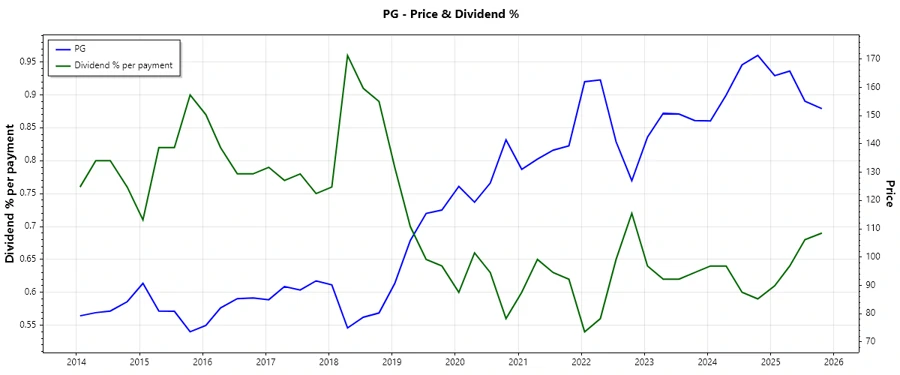
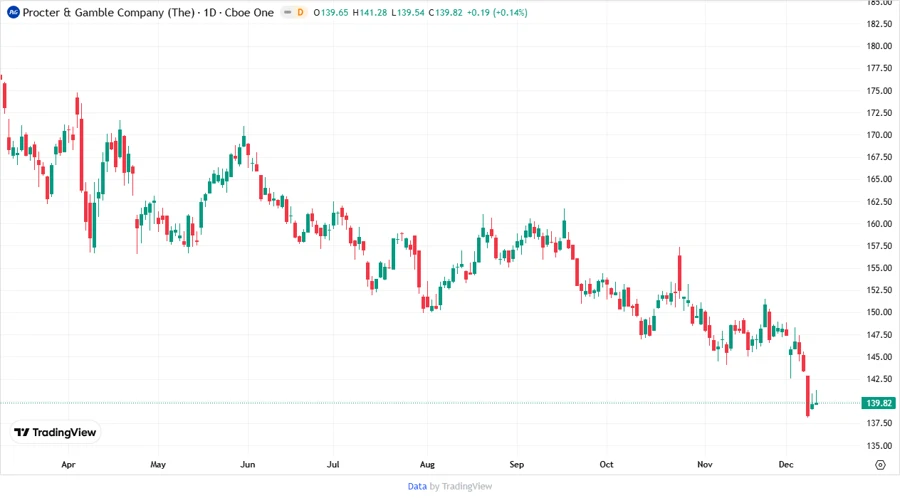
🔍 Price Development
🌟 Dividend Scoring System
| Criterion | Score | Visual |
|---|---|---|
| Dividend Yield | 4 | |
| Dividend Stability | 5 | |
| Dividend Growth | 3 | |
| Payout Ratio | 4 | |
| Financial Stability | 5 | |
| Dividend Continuity | 5 | |
| Cashflow Coverage | 4 | |
| Balance Sheet Quality | 5 |
Total Score: 35/40
🔍 Rating
The Procter & Gamble Company receives a strong recommendation for dividend-focused investors. Its consistent dividend history, coupled with strong fundamentals and strategic financial management, makes it a promising choice for maintaining a diversified and yielding portfolio.