November 07, 2025 a 07:47 am
📊 PG: Dividend Analysis - The Procter & Gamble Company
The Procter & Gamble Company (PG) has a strong dividend profile with a leading market position and a solid track record of returns to shareholders. With an impressive history of 56 consecutive years of dividend increases, PG demonstrates a commitment to maintaining a reliable dividend policy. The current dividend yield of approximately 2.74% positions the company as an attractive option for income-focused investors.
🗣️ Overview
Procter & Gamble operates within a robust sector and continues to demonstrate strong dividend characteristics. The following table provides a snapshot of key dividend metrics:
| Metric | Value |
|---|---|
| Sector | Consumer Goods |
| Dividend Yield | 2.74% |
| Current Dividend per Share | 4.02 USD |
| Dividend History | 56 years |
| Last Cut or Suspension | 2003 |
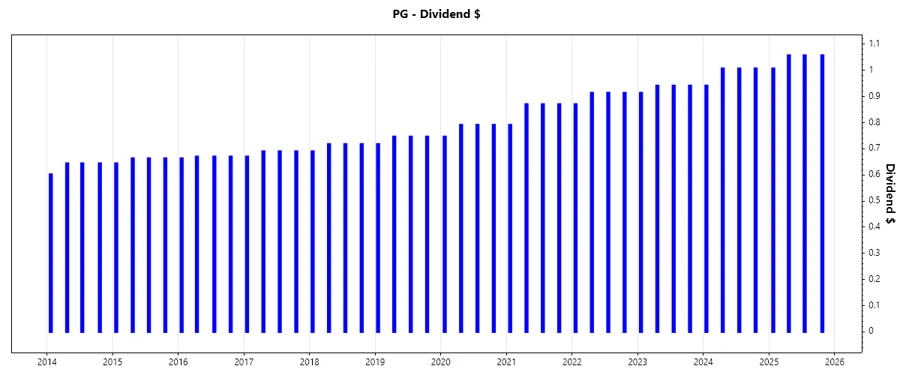
📈 Dividend History
The consistency in PG's dividend history highlights its strong financial health and commitment to shareholders. This history of regular payments and increases is a critical factor for investors seeking steady income.
| Year | Dividend per Share (USD) |
|---|---|
| 2025 | 4.1769 |
| 2024 | 3.9602 |
| 2023 | 3.7354 |
| 2022 | 3.6097 |
| 2021 | 3.4001 |
✅ Dividend Growth
Understanding dividend growth is crucial for assessing the future value of dividend income. Analysts consider organizations with a stable growth in dividends to be solid financial choices.
| Time | Growth |
|---|---|
| 3 years | 5.21% |
| 5 years | 6.03% |
The average dividend growth rate of 6.03% over five years shows moderate but steady dividend growth, reflecting the company's capacity to enhance shareholder returns progressively.
📉 Payout Ratio
The payout ratio analysis offers insight into PG's capacity to sustain its dividend distribution. A stable payout ratio indicates the company's dividends are supported by its profits.
| Key Figure | Ratio |
|---|---|
| EPS-based | 58.46% |
| Free Cash Flow-based | 62.90% |
With a payout ratio of 58.46% based on EPS and 62.90% based on free cash flow, PG demonstrates a prudent approach in balancing earnings retention and dividend payments, ensuring long-term sustainability.
📈 Cashflow & Capital Efficiency
Examining cash flow and capital efficiency is crucial for understanding a company's financial flexibility and operational effectiveness, which influence its dividend policy and reinvestment capabilities.
| Metric | 2023 | 2024 | 2025 |
|---|---|---|---|
| Free Cash Flow Yield | 4.38% | 4.30% | 3.59% |
| Earnings Yield | 4.08% | 3.87% | 4.08% |
| CAPEX to Operating Cash Flow | 18.17% | 16.74% | 21.03% |
| Stock-based Compensation to Revenue | 0.66% | 0.67% | 0.56% |
| Free Cash Flow / Operating Cash Flow Ratio | 81.83% | 83.26% | 78.82% |
PG maintains strong cash flow efficiency with robust free cash flow generation relative to its operating activities. This reflects positively on the company’s ability to sustain its capital returns and dividend commitments.
⚠️ Balance Sheet & Leverage Analysis
The balance sheet analysis highlights PG's financial stability and leverage, essential in evaluating the risk associated with its capital structure.
| Metric | 2023 | 2024 | 2025 |
|---|---|---|---|
| Debt-to-Equity | 0.76 | 0.66 | 0.68 |
| Debt-to-Assets | 0.29 | 0.27 | 0.28 |
| Debt-to-Capital | 0.43 | 0.40 | 0.41 |
| Net Debt to EBITDA | 1.25 | 1.06 | 1.08 |
| Current Ratio | - | - | 0.70 |
| Quick Ratio | 0.44 | 0.53 | 0.49 |
| Financial Leverage | 2.58 | 2.43 | 2.41 |
PG exhibits a well-managed leverage profile with a balanced approach to debt, contributing to financial stability and operational resilience.
📊 Fundamental Strength & Profitability
An analysis of fundamental strength and profitability evaluates PG's operational performance and the efficiency of its income generation.
| Metric | 2023 | 2024 | 2025 |
|---|---|---|---|
| Return on Equity | 31.33% | 29.59% | 30.71% |
| Return on Assets | 12.13% | 12.16% | 12.76% |
| Margins: Net | 17.87% | 17.70% | 18.95% |
| Margins: EBIT | 23.30% | 23.42% | 25.00% |
| Margins: EBITDA | 26.55% | 26.87% | 28.38% |
| Margins: Gross | 47.86% | 51.39% | 51.16% |
| Research & Development to Revenue | 0% | 0% | 2.49% |
Procter & Gamble displays robust profitability and operational efficiency, underscoring its capacity for generating solid returns on equity and assets.
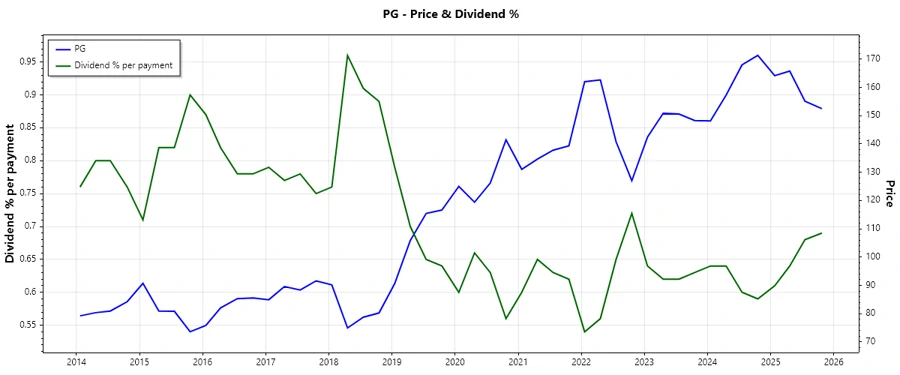
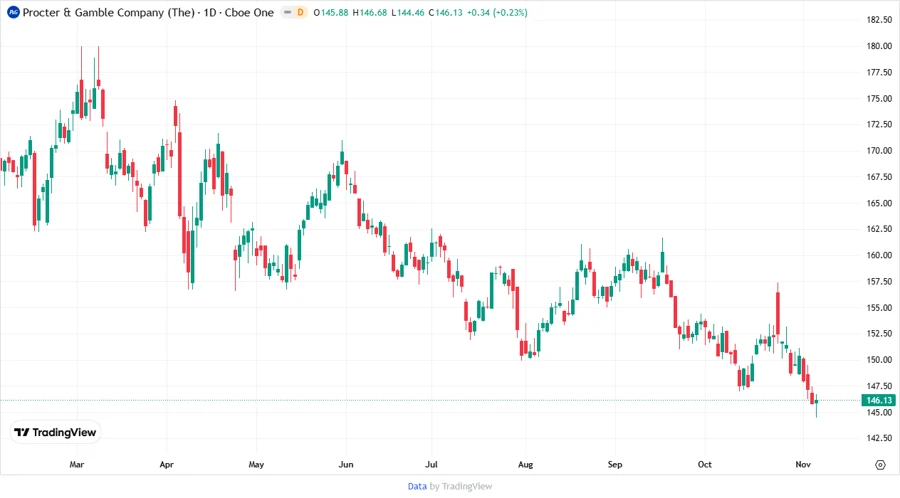
📈 Price Development
📊 Dividend Scoring System
This scoring system evaluates PG's dividend strength, underlying its investment viability based on several key criteria.
| Category | Score | Score Bar |
|---|---|---|
| Dividend Yield | 4 | |
| Dividend Stability | 5 | |
| Dividend Growth | 4 | |
| Payout Ratio | 3 | |
| Financial Stability | 5 | |
| Dividend Continuity | 5 | |
| Cashflow Coverage | 4 | |
| Balance Sheet Quality | 5 |
Total Score: 35/40
🗣️ Rating
In summary, The Procter & Gamble Company showcases a compelling investment proposition with strong dividend fundamentals and a consistent dividend history. Its robust financials, combined with steady growth, contribute to its attractiveness as a stable choice for dividend-focused portfolios.
Smart Data Insight
Master the Perfect Entry & Exit for this Stock
Don't leave your profits to chance. Historically, this stock follows specific seasonal patterns that institutional traders use to maximize returns.
- ✅ Identify the "Golden Buying Window"
- ✅ Avoid high-risk correction cycles
- ✅ Backtested data from the last 20+ years