
June 20, 2026 a 05:15 am
PGR: Fibonacci Analysis - The Progressive Corporation
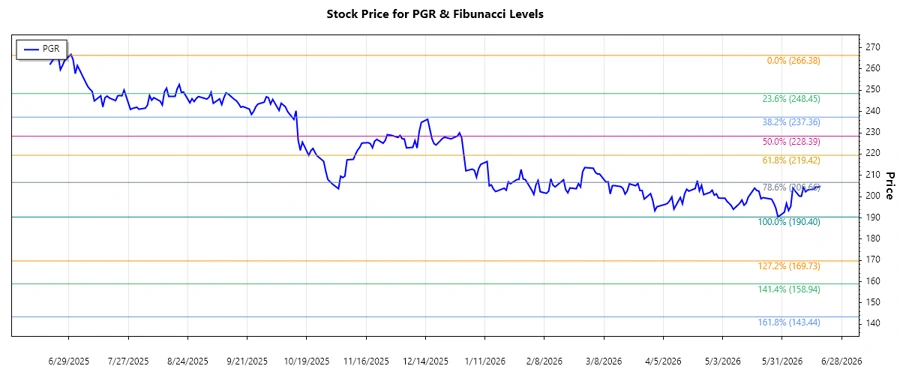
The Progressive Corporation has continued to demonstrate resilience in the competitive insurance market, although its recent trend shows a significant decline. This drop can be attributed to various market conditions and internal challenges. Currently, a technical trend analysis shows a strong downward pattern, reflecting a potential buying opportunity for value investors should the stock stabilize or reverse. Nevertheless, investors need to assess the company's fundamentals and market conditions carefully.
Fibonacci Analysis
| Detail | Information |
|---|---|
| Trend Start Date | 2025-06-20 |
| Trend End Date | 2026-06-18 |
| High Point | 266.38 on 2025-06-23 |
| Low Point | 190.4 on 2026-05-29 |
| Fibonacci Level 0.236 | 206.34 |
| Fibonacci Level 0.382 | 218.95 |
| Fibonacci Level 0.5 | 228.39 |
| Fibonacci Level 0.618 | 237.83 |
| Fibonacci Level 0.786 | 253.42 |
| Current Price | 204.87 as of 2026-06-18 |
| Retracement Zone | Currently in the 0.236 Zone |
| Technical Interpretation | The stock is testing the 0.236 retracement level, which could serve as a temporary support. Further bearish pressure might lead to testing lower levels, while holding above this could indicate the beginning of a potential reversal. |
Conclusion
The Progressive Corporation stock is currently in a downward trend, putting pressure on its price levels. The current technical analysis identifies critical support at the 0.236 Fibonacci level. Should the stock maintain this level as support, a potential technical rebound may occur. However, failure to sustain this level might result in further declines. Investors should weigh the risks of ongoing downward momentum and the opportunities presented by potential technical bounces. Analyst sentiment remains cautious as the stock attempts to stabilize in a volatile market environment.
Smart Data Insight
Master the Perfect Entry & Exit for this Stock
Don't leave your profits to chance. Historically, this stock follows specific seasonal patterns that institutional traders use to maximize returns.
- ✅ Identify the "Golden Buying Window"
- ✅ Avoid high-risk correction cycles
- ✅ Backtested data from the last 20+ years