March 16, 2026 a 03:31 pm

PGR: Dividend Analysis - The Progressive Corporation
The Progressive Corporation's robust dividend profile is complemented by a consistent history of payments and competitive yield. While the recent operations may show slight volatility in growth, their strategic dividend management maintains investor confidence. With a market-leading position in the insurance sector, their value proposition remains strong, bolstered by sound financial metrics despite a cut in 2022.
Overview 📊
The Progressive Corporation operates within the insurance sector, offering a competitive dividend yield, supported by solid financial health and a notably lengthy history of dividend payments, marking its resilience in changing market conditions.
| Data Point | Details |
|---|---|
| Sector | Insurance |
| Dividend Yield | 6.77% |
| Current Dividend per Share | $4.88 |
| Dividend History | 41 years |
| Last Cut or Suspension | 2022 |
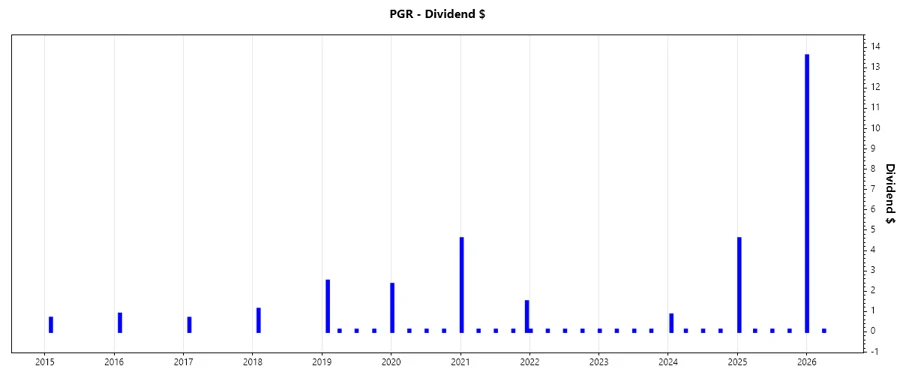
Dividend History 📈
The dividend history is an essential indicator of financial stability and shareholder value. Consistent dividend payments reflect the company's growth and profitability.
| Year | Dividend per Share (USD) |
|---|---|
| 2026 | $13.70 |
| 2025 | $4.90 |
| 2024 | $1.15 |
| 2023 | $0.40 |
| 2022 | $0.40 |
Dividend Growth 📉
Analyzing dividend growth helps in understanding the company's future potential to enhance shareholder return through increased payouts.
| Time | Growth |
|---|---|
| 3 years | 1.31% |
| 5 years | 0.13% |
The average dividend growth is 0.13% over 5 years. This shows moderate but steady dividend growth.
Payout Ratio ✅
Payout ratios are crucial to determine the sustainability of the dividend payments, providing insights into whether earnings fully support the dividends without compromising the business growth or financial health.
| Key Figure Ratio | Percentage |
|---|---|
| EPS-based | 28.26% |
| Free Cash Flow-based | 16.63% |
The EPS-based payout ratio of 28.26% signifies a conservative approach, suggesting that the company retains a significant portion of its earnings for reinvestment or to cushion against future uncertainties. The FCF-based ratio further underlines its dividend's sustainability.
Cashflow & Capital Efficiency
Evaluating the cash flow and capital efficiency provides insights into the company's ability to generate cash and leverage it for sustainable operations, growth, and strategic investments.
| Year | 2025 | 2024 | 2023 |
|---|---|---|---|
| Free Cash Flow Yield | 12.84% | 10.57% | 11.15% |
| Earnings Yield | 7.59% | 6.04% | 4.19% |
| CAPEX to Operating Cash Flow | 1.98% | 1.89% | 2.37% |
| Stock-based Compensation to Revenue | 0.00% | 0.16% | 0.20% |
| Free Cash Flow / Operating Cash Flow Ratio | 98.02% | 98.11% | 97.63% |
The cash flow generation is strong, with high free cash flow yields indicating an efficient use of capital. The low CAPEX to Operating Cash Flow suggests excellent capital management.
Balance Sheet & Leverage Analysis
Assessing the balance sheet and leverage is crucial for evaluating a company's financial health, liquidity, and ability to manage liabilities, which are significant for sustainable operations.
| Year | 2025 | 2024 | 2023 |
|---|---|---|---|
| Debt-to-Equity | 0.00% | 26.94% | 33.97% |
| Debt-to-Assets | 0.00% | 6.52% | 7.77% |
| Debt-to-Capital | 0.00% | 21.22% | 25.36% |
| Net Debt to EBITDA | 0.00 | 0.60 | 1.25 |
| Current Ratio | 0.00 | 0.00 | 0.00 |
| Quick Ratio | 0.00 | 0.00 | 0.00 |
| Financial Leverage | 19.94 | 4.13 | 4.37 |
The progressive decline in leverage ratios indicates enhanced financial prudence, suggesting an improved balance sheet spread over recent fiscal years.
Fundamental Strength & Profitability
Fundamental strength and profitability provide a robust overview of operational efficiency, indicating whether a company efficiently turns its resources into actual profits.
| Year | 2025 | 2024 | 2023 |
|---|---|---|---|
| Return on Equity | 22.25% | 33.14% | 19.25% |
| Return on Assets | 11.16% | 8.02% | 4.40% |
| Margins: Net | 12.72% | 11.26% | 6.29% |
| EBIT | 16.06% | 14.59% | 8.33% |
| EBITDA | 16.38% | 14.97% | 8.79% |
| Gross | 30.78% | 27.74% | 18.95% |
| Research & Development to Revenue | 0.00% | 0.00% | 0.00% |
The profitability metrics reveal effective resource utilization, with robust margins that have improved annually, enhancing Progressive's attractiveness to income-focused investors.
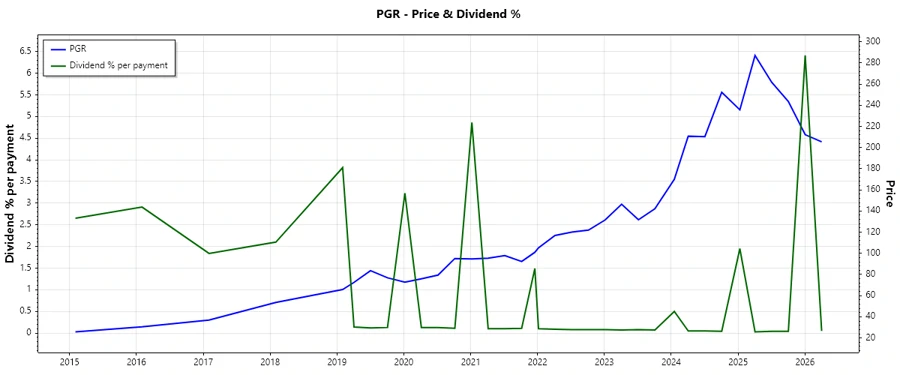
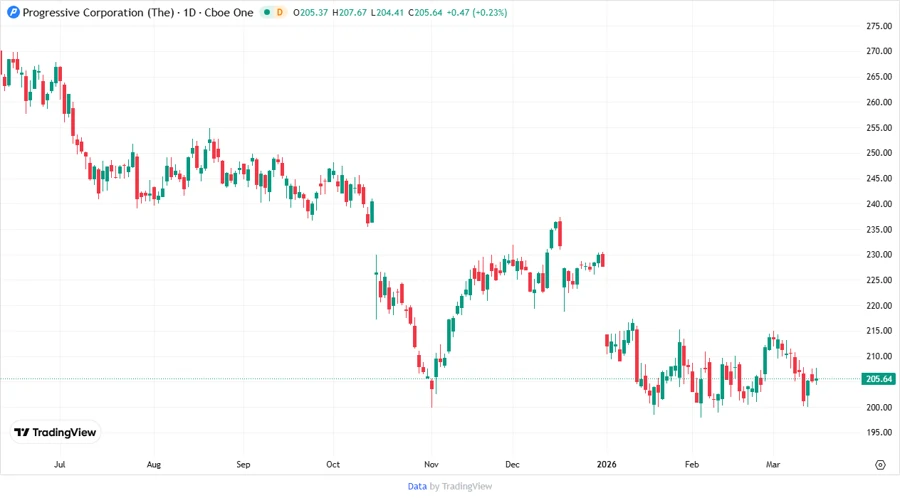
Price Development 🗣️
Dividend Scoring System 🎯
| Criteria | Score | Score Bar |
|---|---|---|
| Dividend yield | 4 | |
| Dividend Stability | 5 | |
| Dividend growth | 2 | |
| Payout ratio | 4 | |
| Financial stability | 5 | |
| Dividend continuity | 5 | |
| Cashflow Coverage | 4 | |
| Balance Sheet Quality | 5 |
Total Score: 34/40
Rating & Recommendation 🏆
The Progressive Corporation is rated highly for its superior dividend stability, robust balance sheet quality, and consistent payout history. Despite modest growth, its strong financial fundamentals and low payout ratio make it a solid bet for income-oriented investors. It can be a reliable investment option, particularly for those valuing stability and moderate-yield dividends.