November 14, 2025 a 02:47 am

PGR: Dividend Analysis - The Progressive Corporation
📊 The Progressive Corporation (PGR) presents an intriguing dividend profile. With a modest dividend yield of 2.01%, the company marks its resilience through 40 years of dividend history. However, a recent dividend cut in 2022 highlights caution. Analysts will be watching closely to see if past growth trends can return for long-term investors. ⚠️
Overview
🔎 A detailed look at Progressive's dividend metrics provides both strength and caution signals for investors.
| Attribute | Details |
|---|---|
| Sector | Insurance |
| Dividend Yield | 2.01% |
| Current Dividend Per Share | 1.16 USD |
| Dividend History | 40 years |
| Last Cut or Suspension | 2022 |
Dividend History
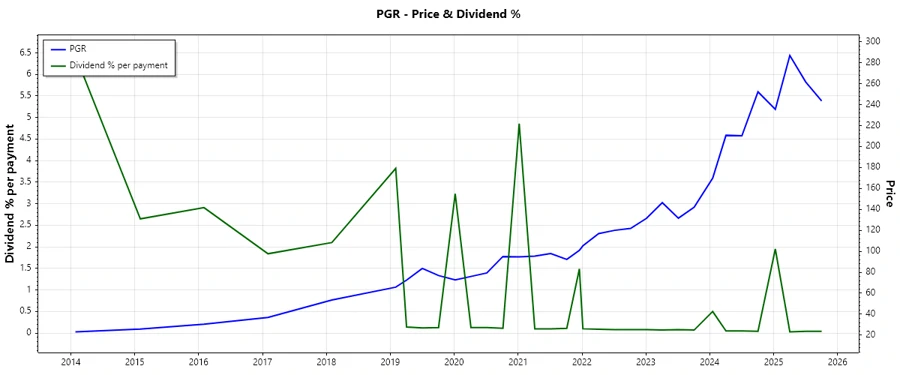
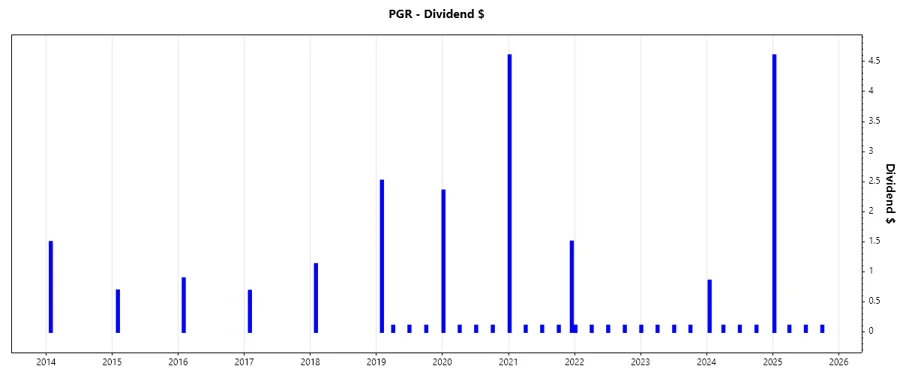
🗓️ Examining Progressive’s dividend track record highlights its long-standing commitment to shareholder returns, though the recent cut poses a question on future consistency. Understanding past payments provide insights on stability and predictability.
| Year | Dividend Per Share (USD) |
|---|---|
| 2025 | 4.9 |
| 2024 | 1.15 |
| 2023 | 0.4 |
| 2022 | 0.4 |
| 2021 | 6.4 |
Dividend Growth
📈 Investigating dividend growth helps gauge a company’s potential for future payouts. The negative growth over 3 and 5 years calls for a cautious outlook, yet understanding these metrics is key to evaluating future possibilities.
| Time | Growth |
|---|---|
| 3 years | -0.44% |
| 5 years | -0.16% |
The average dividend growth is -0.16% over 5 years. This shows moderate but steady decline in dividend growth, prompting investors to seek whether future strategies might reverse this trend.
Payout Ratio
Analyzing payout ratios reveals how much of the company’s earnings and free cash flow are dedicated to dividends. Low ratios might suggest strong reinvestment back into the business, ensuring future growth capacity while mitigating risk.
| Key figure | Ratio |
|---|---|
| EPS-based | 6.40% |
| Free cash flow-based | 4.15% |
✅ With 6.40% EPS and 4.15% FCF payout ratios, Progressive Corporation maintains a conservative payout approach. This prudence may favor long-term sustainability and strategic reinvestment.
Cashflow & Capital Efficiency
Analyzing financial metrics sheds light on cash stability and the efficiency of capital application, essential metrics for holistic financial assessments.
| 2024 | 2023 | 2022 | |
|---|---|---|---|
| Free Cash Flow Yield | 10.57% | 11.15% | 8.65% |
| Earnings Yield | 6.04% | 4.19% | 0.95% |
| CAPEX to Operating Cash Flow | 1.95% | 2.37% | 4.26% |
| Stock-based Compensation to Revenue | 0.16% | 0.20% | 0.25% |
| Free Cash Flow / Operating Cash Flow Ratio | 98.11% | 97.63% | 95.74% |
Proficient capital efficiency reflects strategic financial management and ensures readiness for future investments or addressing downturns.
Balance Sheet & Leverage Analysis
A robust examination of leverage is vital to ensure a company isn't over-extended and can efficiently manage its obligations.
| 2024 | 2023 | 2022 | |
|---|---|---|---|
| Debt-to-Equity | 26.94% | 33.97% | 40.20% |
| Debt-to-Assets | 6.52% | 7.77% | 8.46% |
| Debt-to-Capital | 21.22% | 25.36% | 28.67% |
| Net Debt to EBITDA | 0.60 | 1.25 | 4.20 |
| Current Ratio | - | - | 11.98 |
| Quick Ratio | - | - | 11.98 |
⚠️ The balance sheet ratios verify Progressive's capacity to service debt while remaining liquid. Recent trends towards reducing leverage underscore financial solidity.
Fundamental Strength & Profitability
Examining fundamental strength and profitability metrics aids in understanding the company's potential to sustain profits and create value.
| 2024 | 2023 | 2022 | |
|---|---|---|---|
| Return on Equity | 33.14% | 19.25% | 4.54% |
| Return on Assets | 8.02% | 4.40% | 0.96% |
| Net Margin | 11.26% | 6.29% | 1.46% |
| EBIT Margin | 14.59% | 8.33% | 2.35% |
| EBITDA Margin | 14.97% | 8.79% | 2.97% |
| Gross Margin | 27.74% | 18.95% | 15.22% |
| R&D to Revenue | 0% | 0% | 0% |
✅ Profound profitability metrics increase shareholder value, key in dividend sustainability, while efficient asset utilization bolsters confidence in potential growth amidst evolving market dynamics.
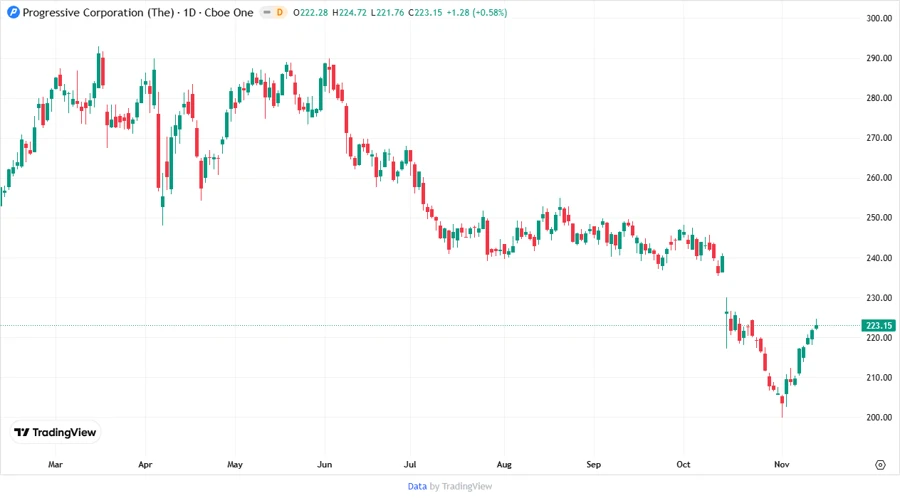
Price Development
Dividend Scoring System
The Dividend Scoring System evaluates key aspects influencing dividend sustainability and growth prospects.
| Category | Score | Score Bar |
|---|---|---|
| Dividend yield | 3/5 | |
| Dividend Stability | 4/5 | |
| Dividend growth | 2/5 | |
| Payout ratio | 5/5 | |
| Financial stability | 4/5 | |
| Dividend continuity | 3/5 | |
| Cashflow Coverage | 4/5 | |
| Balance Sheet Quality | 5/5 |
Total Score: 30/40
Rating
🗣️ In summary, Progressive Corporation's dividend profile shows promise with strong financial backing but requires vigilance given recent disruptions in dividend growth. The overall economic resilience and fiscal prudence make this a potential consideration for discerning investors aware of the larger market dynamics and seeking medium to long-term benefits. ✅
Smart Data Insight
Master the Perfect Entry & Exit for this Stock
Don't leave your profits to chance. Historically, this stock follows specific seasonal patterns that institutional traders use to maximize returns.
- ✅ Identify the "Golden Buying Window"
- ✅ Avoid high-risk correction cycles
- ✅ Backtested data from the last 20+ years