August 25, 2025 a 11:32 am


PGR: Dividend Analysis - The Progressive Corporation
The Progressive Corporation stands out as a leader in the insurance industry with a robust dividend history. Although recent dividend adjustments were noted, the substantial 40-year history of continuous dividend payments underlines the company's commitment to returning value to its shareholders. However, recent cutbacks and negative growth warrant caution for income-focused investors.
📊 Overview
In the following analysis, we delve into the key dividend metrics of The Progressive Corporation, emphasizing its role in the financial strategy of the company.
| Metric | Value |
|---|---|
| Sector | Insurance |
| Dividend yield | 1.97 % |
| Current dividend per share | $1.16 USD |
| Dividend history | 40 years |
| Last cut or suspension | 2022 |
📈 Dividend History
Understanding The Progressive Corporation’s historical dividend payments provides insights into its commitment to shareholder returns even during fluctuating market conditions.
| Year | Dividend per Share (USD) |
|---|---|
| 2025 | 4.9 |
| 2024 | 1.15 |
| 2023 | 0.4 |
| 2022 | 0.4 |
| 2021 | 6.4 |
📊 Dividend Growth
Analysts often use dividend growth as a measure of a company’s profitability and financial health. The provided data offers a snapshot of growth trends, critical for predicting future performance.
| Time | Growth |
|---|---|
| 3 years | -0.44 % |
| 5 years | -0.16 % |
The average dividend growth is -0.16 % over 5 years. This shows moderate but steady dividend adjustments necessitating caution.
⚖️ Payout Ratio
Payout ratios are essential for assessing how much of the company's earnings are returned to shareholders. Here, we evaluate the company's earnings capacity relative to its dividend policy.
| Key figure ratio | Percentage |
|---|---|
| EPS-based | 6.54 % |
| Free cash flow-based | 4.34 % |
The EPS payout ratio of 6.54 % and FCF payout ratio of 4.34 % suggest a conservative and sustainable dividend policy.
💰 Cashflow & Capital Efficiency
An analysis of cashflows underscores the efficiency and sustainability of dividend payments. It is crucial in assessing the company's ability to generate sufficient cash flow to support capital expenditure and shareholder returns.
| Metric | 2024 | 2023 | 2022 |
|---|---|---|---|
| Free Cash Flow Yield | 10.57 % | 11.15 % | 8.65 % |
| CAPEX to Operating Cash Flow | 1.88 % | 2.37 % | 4.26 % |
| Stock-based Compensation to Revenue | 0.16 % | 0.20 % | 0.25 % |
| Free Cash Flow / Operating Cash Flow Ratio | 98.11 % | 97.63 % | 95.74 % |
| Earnings Yield | 6.04 % | 4.19 % | 0.95 % |
Across the years, The Progressive Corporation demonstrates a high Free Cash Flow Yield and well-maintained CAPEX, highlighting efficient cash use and sustainable dividend payments.
📋 Balance Sheet & Leverage Analysis
Evaluating the balance sheet provides insights into the company’s financial stability and leverage ratio. These metrics are integral for understanding debt management and risk exposure.
| Metric | 2024 | 2023 | 2022 |
|---|---|---|---|
| Debt-to-Equity | 0.27 | 0.34 | 0.41 |
| Debt-to-Assets | 0.065 | 0.078 | 0.093 |
| Net Debt to EBITDA | 0.60 | 1.25 | 4.28 |
The company's moderate debt levels and reduced leverage over recent years enhance financial stability and suggest risk mitigation.
📊 Fundamental Strength & Profitability
Analyzing profitability ratios allows for assessing operational efficiency and the company’s ability to generate profits, which are crucial for long-term sustainability and shareholder returns.
| Metric | 2024 | 2023 | 2022 |
|---|---|---|---|
| Return on Equity | 33.14 % | 19.25 % | 4.54 % |
| Return on Assets | 8.02 % | 4.40 % | 1.03 % |
| Net Margin | 11.25 % | 6.29 % | 1.46 % |
High return metrics and expanding margins indicate strong operational efficiency and profit-generation capacity.
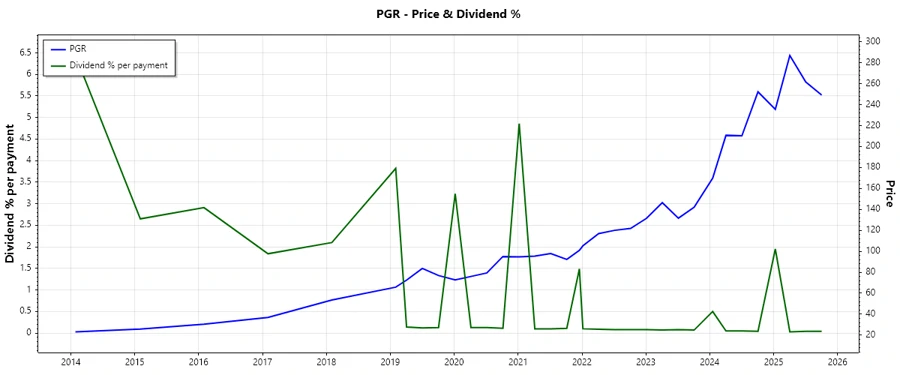
📊 Price Development
🗣️ Dividend Scoring System
| Category | Score | Score Bar |
|---|---|---|
| Dividend yield | 3 | |
| Dividend Stability | 4 | |
| Dividend growth | 2 | |
| Payout ratio | 5 | |
| Financial stability | 4 | |
| Dividend continuity | 4 | |
| Cashflow Coverage | 5 | |
| Balance Sheet Quality | 4 |
Total Score: 31/40
✅ Rating
The Progressive Corporation maintains a respectable dividend profile supported by a conservative payout ratio and strong cash flow metrics. However, the negative dividend growth trajectory marks a cautious outlook for pure dividend investors. Overall, the company presents a solid investment case contingent on its robust financial stability.
Smart Data Insight
Master the Perfect Entry & Exit for this Stock
Don't leave your profits to chance. Historically, this stock follows specific seasonal patterns that institutional traders use to maximize returns.
- ✅ Identify the "Golden Buying Window"
- ✅ Avoid high-risk correction cycles
- ✅ Backtested data from the last 20+ years