August 06, 2025 a 03:15 am
PFG: Trend and Support & Resistance Analysis - Principal Financial Group, Inc.
The Principal Financial Group, Inc., with its diverse segments ranging from retirement solutions to insurance, is a well-rounded financial entity. Recent data analysis suggests varying market sentiments. Currently, given the EMA trends, the stock might present opportunities for strategic entries at key levels. Investors should also note potential volatility in light of observed support and resistance levels.
Trend Analysis
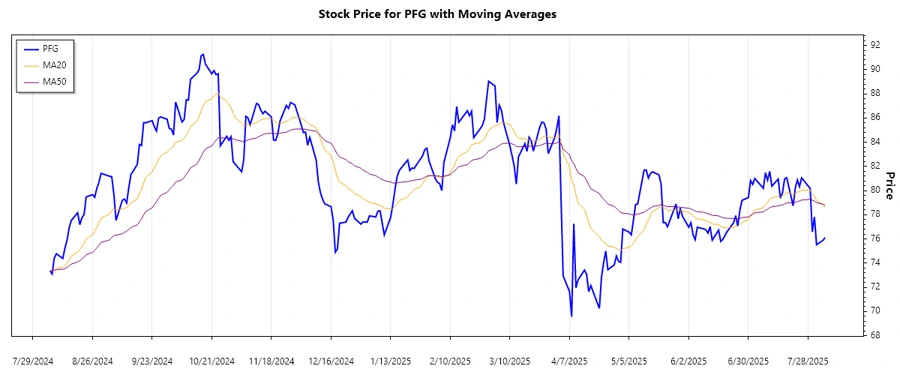
The calculation of the Exponential Moving Averages (EMA) indicates that the EMA20 is currently below the EMA50, suggesting a ▼ downward trend. Here is a summary of the last 7 days:
| Date | Close Price | Trend |
|---|---|---|
| 2025-08-05 | 76.12 | ▼ |
| 2025-08-04 | 75.88 | ▼ |
| 2025-08-01 | 75.53 | ▼ |
| 2025-07-31 | 77.83 | ▲ |
| 2025-07-30 | 76.59 | ▼ |
| 2025-07-29 | 80.19 | ▲ |
| 2025-07-28 | 80.39 | ▲ |
Currently, the data confirms a short-term downward phase which suggests heightened caution. This trend is depicted in the chart below.
Support and Resistance
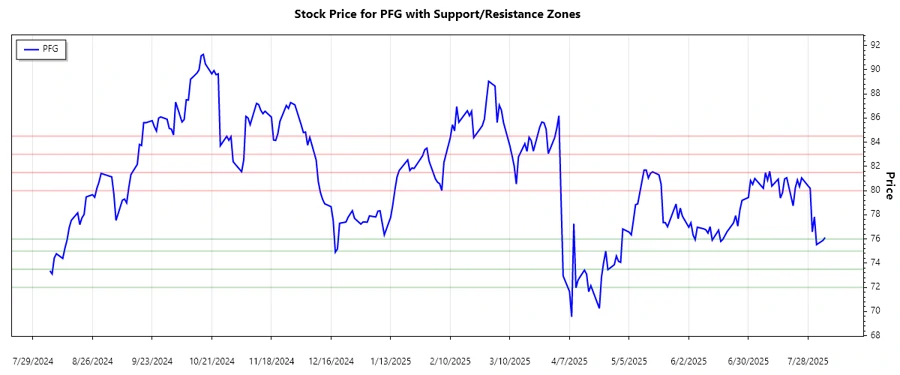
Based on historical data of the closing prices, the following support and resistance zones have been identified:
| Zone | From | To | Direction |
|---|---|---|---|
| Support 1 | 75.00 | 76.00 | ▼ |
| Support 2 | 72.00 | 73.50 | ▼ |
| Resistance 1 | 80.00 | 81.50 | ▲ |
| Resistance 2 | 83.00 | 84.50 | ▲ |
As of the latest pricing data, the stock is near the lower boundary of the resistance zone, indicating potential resistance testing.
Conclusion
Principal Financial Group, Inc. exhibits a bearish short-term trend as indicated by the EMA analysis, while nearing significant resistance zones might pose upside risks. Should supportive elements surpass resistance, a reversal could materialize, providing opportunities for strategists. Conversely, failure to breach resistance may reinforce bearish stance. Strategic positioning could be key, utilizing dynamic resistance and support levels. The diversified portfolio of the company remains pivotal amidst market flux.
Smart Data Insight
Master the Perfect Entry & Exit for this Stock
Don't leave your profits to chance. Historically, this stock follows specific seasonal patterns that institutional traders use to maximize returns.
- ✅ Identify the "Golden Buying Window"
- ✅ Avoid high-risk correction cycles
- ✅ Backtested data from the last 20+ years