July 25, 2025 a 02:03 pm

PFG: Trend and Support & Resistance Analysis - Principal Financial Group, Inc.
Principal Financial Group, Inc. exhibits a dynamic business model providing a range of financial services globally. The stock has shown mixed performance with periods of volatility. Recent trends and technical indicators will shed light on the current price action and what investors can anticipate. The analysis will also identify key support and resistance levels, vital for trading strategies. Overall, the stock's historical and technical profile provides both opportunities and challenges.
Trend Analysis
The calculation of the Exponential Moving Averages (EMAs) offers insight into the stock's trend. Both EMA20 and EMA50 provide a gauge on short- and mid-term momentum. Here’s a detailed look at the recent price trend:
| Date | Close Price | Trend |
|---|---|---|
| 2025-07-25 | 80.305 | ▲ Up |
| 2025-07-24 | 80.33 | ▲ Up |
| 2025-07-23 | 80.88 | ▲ Up |
| 2025-07-22 | 80.2 | ▲ Up |
| 2025-07-21 | 78.74 | ▲ Up |
| 2025-07-18 | 81.06 | ▲ Up |
| 2025-07-17 | 80.97 | ▲ Up |
The current trend, as indicated by the EMA, points to an upward trajectory (▲). When the EMA20 surpasses the EMA50, it suggests a continuation of buying momentum. This positive trend can instill investor confidence in anticipating higher prices.
Support and Resistance
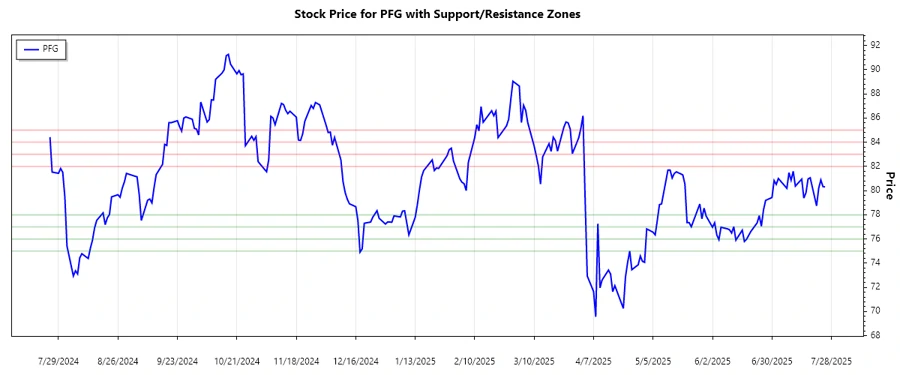
The following illustrates key support and resistance zones for Principal Financial Group, Inc. These levels are vital for identifying potential reversal or continuation areas:
| Zone Type | From | To |
|---|---|---|
| Support Level 1 | 77.00 | 78.00 |
| Support Level 2 | 75.00 | 76.00 |
| Resistance Level 1 | 82.00 | 83.00 |
| Resistance Level 2 | 84.00 | 85.00 |
Currently, the stock is trading near its resistance levels, suggesting possible selling pressures. If these levels hold, they could signal a reversal, whereas a break could imply further upside potential.
Conclusion
The stock of Principal Financial Group, Inc. is trending upwards, supported by the short-term EMA analysis. Despite the proximity to resistance levels, the momentum indicates possible further upward movement if it breaks past these barriers. Investors should remain cautious of confirmation signals before executing trades. The business' robust segments contribute to its financial resilience, but market volatilities may present risks. Consistent monitoring of technical indicators is recommended for informed decision-making.
Smart Data Insight
Master the Perfect Entry & Exit for this Stock
Don't leave your profits to chance. Historically, this stock follows specific seasonal patterns that institutional traders use to maximize returns.
- ✅ Identify the "Golden Buying Window"
- ✅ Avoid high-risk correction cycles
- ✅ Backtested data from the last 20+ years