
July 27, 2026 a 08:00 am

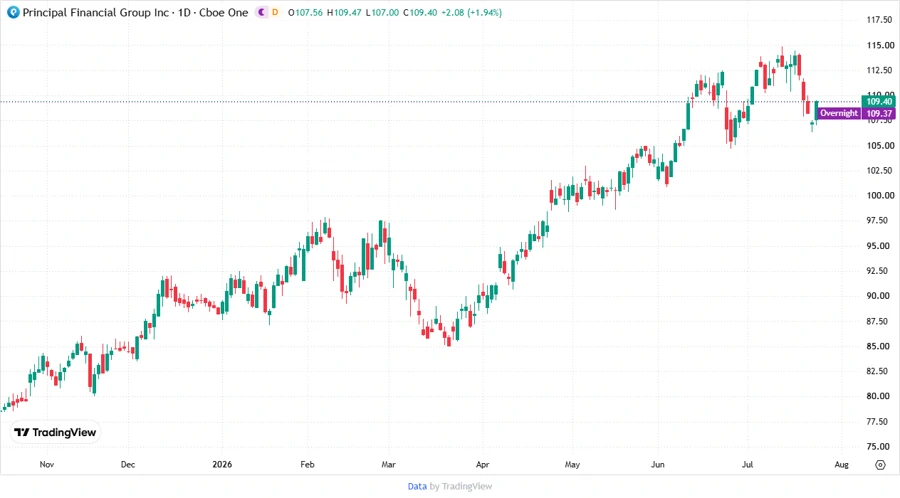
PFG: Fundamental Ratio Analysis - Principal Financial Group, Inc.
The Principal Financial Group, Inc. operates in the financial services sector, offering a diverse range of services to businesses and individuals. With steady scores across its fundamental metrics, PFG represents a stable investment prospect, although the recent market conditions warrant careful consideration of future trends.
Fundamental Rating
The fundamental score suggests a relatively balanced financial health, indicating potential for steady performance over the medium term.
| Category | Score | Score Visualization |
|---|---|---|
| Discounted Cash Flow | 5 | |
| Return on Equity | 4 | |
| Return on Assets | 2 | |
| Debt to Equity | 3 | |
| Price to Earnings | 3 | |
| Price to Book | 2 |
Historical Rating
The historical context emphasizes stable performance in key financial metrics, with a need to monitor any shifts in these categories closely.
| Date | Overall | DCF | ROE | ROA | D/E | P/E | P/B |
|---|---|---|---|---|---|---|---|
| 2026-07-24 | 3 | 5 | 4 | 2 | 3 | 3 | 2 |
| Previous Date | 0 | 5 | 4 | 2 | 3 | 3 | 2 |
Analyst Price Targets
Analysts project a median price target of $107, indicating moderate growth potential but with a recommendation to evaluate market volatility.
| High | Low | Median | Consensus |
|---|---|---|---|
| $125 | $92 | $107 | $104.67 (Hold) |
Analyst Sentiment
There is a balanced sentiment among analysts with a tilt towards holding the stock, reflecting cautious optimism and a stable outlook.
| Recommendation | Number | Distribution |
|---|---|---|
| Strong Buy | 0 | |
| Buy | 5 | |
| Hold | 14 | |
| Sell | 6 | |
| Strong Sell | 0 |
Conclusion
The Principal Financial Group, Inc. offers a reliable investment option with consistent fundamentals and a stable outlook from analysts. While it enjoys moderate bullish sentiment, investors should remain vigilant to macroeconomic factors that may influence performance. Its diversified product range and market presence provide a buffer against market volatility, making PFG a potential stable asset in a well-rounded portfolio. Nevertheless, keen observation of sector-specific dynamics is advised.
Smart Data Insight
Master the Perfect Entry & Exit for this Stock
Don't leave your profits to chance. Historically, this stock follows specific seasonal patterns that institutional traders use to maximize returns.
- ✅ Identify the "Golden Buying Window"
- ✅ Avoid high-risk correction cycles
- ✅ Backtested data from the last 20+ years