
July 04, 2026 a 06:44 am
PFG: Fibonacci Analysis - Principal Financial Group, Inc.
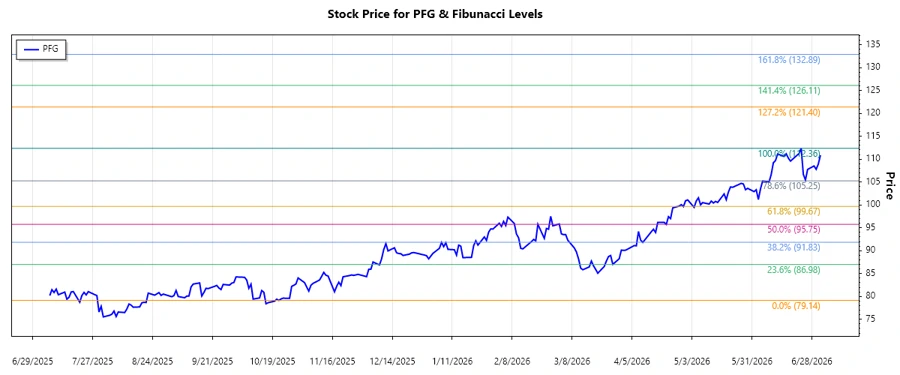
Principal Financial Group, Inc. (PFG) has exhibited a significant upward trend over the analyzed period, showing resilience in market conditions. This trend has been supported by the company's diversified operations across various financial service segments. Recent price movements suggest potential opportunities for investors looking for stable growth within the financial services sector.
Fibonacci Analysis
| Detail | Information |
|---|---|
| Trend Analysis Period | 2025-11-10 to 2026-07-02 |
| High Point | $112.36 on 2026-06-23 |
| Low Point | $79.14 on 2025-10-22 |
| Fibonacci Level | Price Level |
|---|---|
| 0.236 | $91.48 |
| 0.382 | $96.80 |
| 0.5 | $100.75 |
| 0.618 | $104.69 |
| 0.786 | $110.21 |
The current price of $110.87 is within the 0.786 retracement zone. This indicates that the stock is approaching strong resistance level, making it crucial for traders to watch subsequent price action for potential breakouts or reversals.
Technically, this retracement suggests the possibility of the stock facing resistance but, if breached, it could confirm further bullish momentum. Traders might consider this level for setting stop-loss orders or planning entry points for potential long positions.
Conclusion
Principal Financial Group, Inc.'s steady upward trajectory within the analyzed period highlights its strength in the current financial landscape. The 0.786 Fibonacci level suggests a critical juncture, with price behavior at this threshold likely defining the short-term outlook. While breaking this level could indicate continued bullish momentum with further upside potential, failure might point to a consolidation or pullback. As always, investors should weigh both opportunities and risks, keeping in mind macroeconomic factors and the company's fundamental health.
Smart Data Insight
Master the Perfect Entry & Exit for this Stock
Don't leave your profits to chance. Historically, this stock follows specific seasonal patterns that institutional traders use to maximize returns.
- ✅ Identify the "Golden Buying Window"
- ✅ Avoid high-risk correction cycles
- ✅ Backtested data from the last 20+ years