May 23, 2026 a 04:44 pm
PFG: Fibonacci Analysis - Principal Financial Group, Inc.
The stock of Principal Financial Group, Inc. (PFG) has shown a strong upward trend over the recent months. The company's diverse product offerings in retirement and asset management solutions have contributed to its positive market performance, allowing it to capture increasing investor interest. Despite economic uncertainties, PFG has maintained resilience, supported by robust segment results and global operations.
Fibonacci Analysis
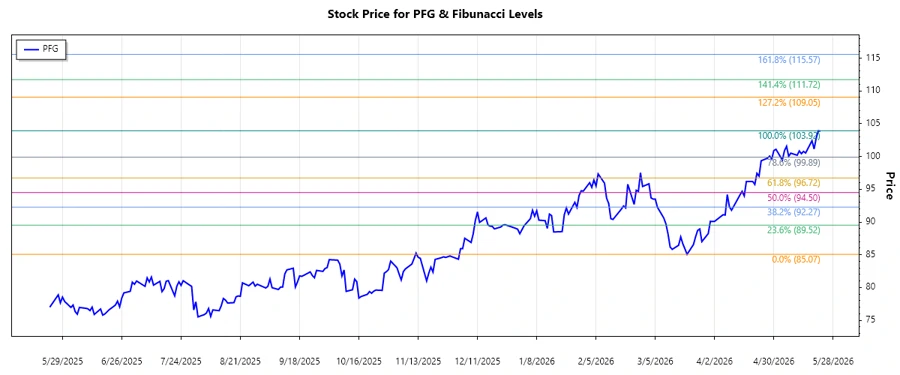
Based on the historical data from March 16, 2026, to May 22, 2026, an upward trend was identified with a low of $85.07 on March 20, 2026, and a high of $103.92 on May 21, 2026.
| Trend Details | Value |
|---|---|
| Start Date | March 16, 2026 |
| End Date | May 22, 2026 |
| High Point | $103.92 on May 21, 2026 |
| Low Point | $85.07 on March 20, 2026 |
Fibonacci Retracement Levels Calculated from High-Low:
| Fibonacci Level | Price Level |
|---|---|
| 0.236 | $99.44 |
| 0.382 | $97.14 |
| 0.5 | $94.50 |
| 0.618 | $91.86 |
| 0.786 | $88.89 |
As of the latest price on May 22, 2026, which is $103.85, the stock is above all key Fibonacci retracement levels, suggesting it has not entered any retracement zone.
This indicates a potential continuation of the uptrend, with $103.92 acting as a potential resistance level to observe.
Conclusion
Principal Financial Group, Inc.'s stock has experienced a significant uptrend, reflecting strong market confidence and robust company performance. Major risks include potential macroeconomic shifts and industry competition, which could affect future performance. Nonetheless, with strong fundamentals and diverse operations, PFG has positioned itself well for continued growth. Analysts should monitor any resistance at the previous high level closely, as it may signal further bullish momentum or the onset of a correction if broken convincingly.
Smart Data Insight
Master the Perfect Entry & Exit for this Stock
Don't leave your profits to chance. Historically, this stock follows specific seasonal patterns that institutional traders use to maximize returns.
- ✅ Identify the "Golden Buying Window"
- ✅ Avoid high-risk correction cycles
- ✅ Backtested data from the last 20+ years