January 10, 2026 a 06:44 am
PFG: Fibonacci Analysis - Principal Financial Group, Inc.
Principal Financial Group, Inc. has demonstrated a consistent performance with moderate volatility in its stock prices. As a global provider of retirement and asset management services, its diverse product portfolio aids in stabilizing revenue streams. The stock has shown resilience against market fluctuations, making it a potentially attractive option for medium to long-term investors.
Fibonacci Analysis
| Detail | Value |
|---|---|
| Start Date | 2025-08-06 |
| End Date | 2026-01-09 |
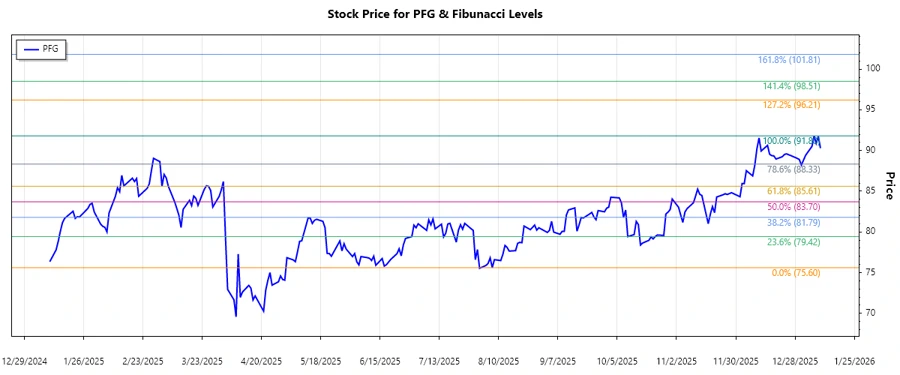
| High Price (Date) | $91.80 (2026-01-06) |
| Low Price (Date) | $75.60 (2025-08-07) |
| Current Price | $90.29 |
Fibonacci Levels
| Level | Price |
|---|---|
| 0.236 | $81.93 |
| 0.382 | $84.33 |
| 0.5 | $86.70 |
| 0.618 | $89.07 |
| 0.786 | $91.69 |
The current price of $90.29 is in the 0.618 Fibonacci retracement level, indicating potential consolidation or reversal.
The 0.618 level might act as a strong support, suggesting a potential bounce back unless broken decisively.
Conclusion
The Principal Financial Group, Inc. stock's recent uptrend suggests strong investor confidence, likely influenced by the company’s robust financial performance and diversification in financial products. The current price sitting on the 0.618 retracement level could signify a strong support base, potentially providing an entry point for long-term investors. However, a breach below this key level might lead to further downside risk. Analysts will closely monitor the price tests near this level to gauge future momentum. It is essential to consider macroeconomic factors and the company's quarterly performance reports for more reliable insights.