June 06, 2025 a 06:44 am
PFG: Fibonacci Analysis - Principal Financial Group, Inc.
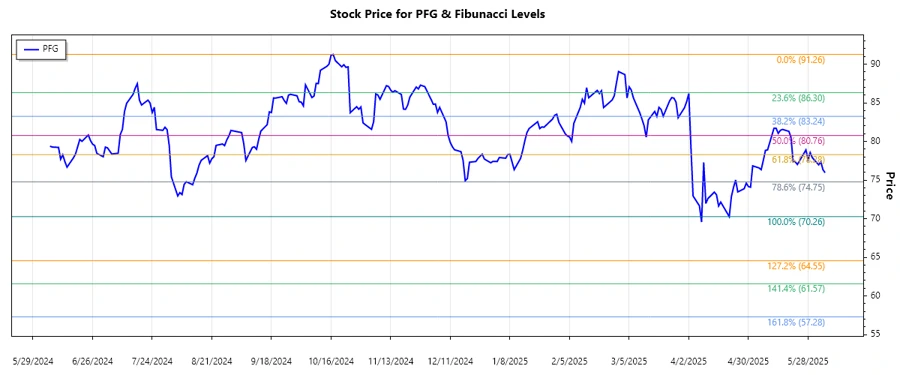
The recent analysis of Principal Financial Group, Inc. (PFG) reveals a definitive downtrend over the last few months. This downtrend is characterized by a significant decrease from a high of $91.26 reached on October 17, 2024, to a low of $70.26 on April 21, 2025. The company's diverse portfolio offers stability, but recent market conditions have impacted its stock performance. Investors should consider potential retracement opportunities as the stock approaches long-term support levels.
Fibonacci Analysis
| Trend Period | Start Date | End Date |
|---|---|---|
| Downtrend | October 17, 2024 | April 21, 2025 |
| Price Point | Date | Price |
|---|---|---|
| High | 2024-10-17 | $91.26 |
| Low | 2025-04-21 | $70.26 |
| Fibonacci Level | Price |
|---|---|
| 0.236 | $75.54 |
| 0.382 | $78.89 |
| 0.5 | $80.76 |
| 0.618 | $82.62 |
| 0.786 | $85.13 |
The current stock price is $75.94, which places it within the 0.236 retracement zone. This suggests a potential support level, which could indicate a stabilization or future upward movement if supported by additional technical indicators.
Analysis of the present stock positioning suggests noteworthy support around the 0.236 Fibonacci level, indicative of a possible reversal or pause in the prevailing downtrend.
Conclusion
The Principal Financial Group, Inc. exhibits a pronounced downtrend over recent months, with the current price testing the 0.236 Fibonacci retracement level. This can act as a critical support, offering potential opportunities for reversal. However, sustained weakness at this level may risk further declines. On the upside, reclaiming higher retracement levels like 0.382 and 0.5 could reinforce bullish prospects. Analysts should closely monitor market conditions, management strategies, and macroeconomic factors influencing the company. While the diverse product range of PFG aids resilience, potential risks in the financial markets require careful observation.
Smart Data Insight
Master the Perfect Entry & Exit for this Stock
Don't leave your profits to chance. Historically, this stock follows specific seasonal patterns that institutional traders use to maximize returns.
- ✅ Identify the "Golden Buying Window"
- ✅ Avoid high-risk correction cycles
- ✅ Backtested data from the last 20+ years