May 08, 2026 a 12:46 pm

PFG: Dividend Analysis - Principal Financial Group, Inc.
Principal Financial Group, Inc. presents an intriguing dividend profile with a history of consistent payouts and moderate growth. The company's stable dividend yield of 3.19% coupled with a 25-year history of uninterrupted payments positions it as a reliable income-generating asset. The calculated payout ratios suggest a healthy balance between shareholder returns and financial prudence, although the recent dividend cuts raise some cautionary flags.
📊 Overview
The Principal Financial Group operates within a solid framework that has seen its dividend yield stabilize around 3.19%. The company has paid dividends consistently for 25 years, demonstrating its commitment to returning value to shareholders. Despite some recent fluctuations, this history showcases resilience.
| Criteria | Details |
|---|---|
| Sector | Financials |
| Dividend yield | 3.19% |
| Current dividend per share | 3.03 USD |
| Dividend history | 25 years |
| Last cut or suspension | None |
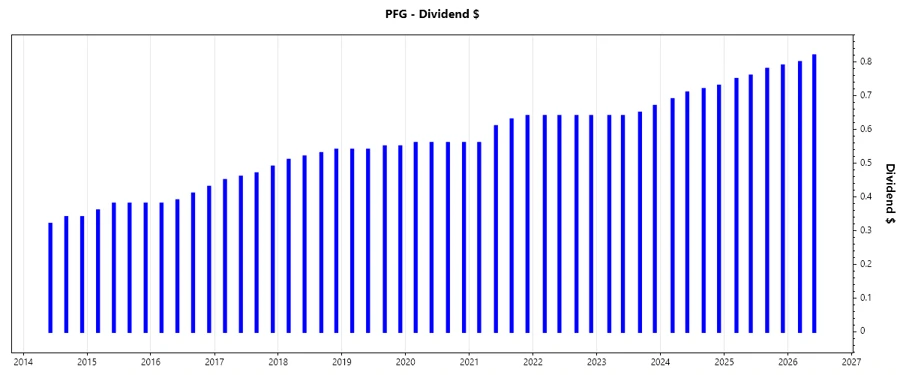
📈 Dividend History
Understanding the history of dividends is crucial as it helps investors evaluate the consistency and reliability of a company's dividend payouts. Principal Financial Group has demonstrated strong capabilities in maintaining dividend payments, a vital sign of stability to consider when assessing investment opportunities.
| Year | Dividend per Share (USD) |
|---|---|
| 2026 | 1.62 |
| 2025 | 3.08 |
| 2024 | 2.85 |
| 2023 | 2.60 |
| 2022 | 2.56 |
📉 Dividend Growth
The growth rate of dividends is an essential indicator for investors seeking to assess the potential for future income increases. With 3-year dividend growth at approximately 6.36% and 5-year growth at 6.58%, the company presents evidence of steady albeit moderate growth that supports future earnings augmentation.
| Time | Growth |
|---|---|
| 3 years | 6.36% |
| 5 years | 6.58% |
The average dividend growth is 6.58% over 5 years. This shows moderate but steady dividend growth.
🗣️ Payout Ratio
Payout ratios are a key measure of dividend sustainability. The company's EPS-based payout ratio sits at 43.08%, while the free cash flow-based ratio stands at 18.03%. Both figures suggest a conservative approach, ensuring substantial room for reinvestment and potential dividend increases.
| Key figure | Ratio |
|---|---|
| EPS-based | 43.08% |
| Free cash flow-based | 18.03% |
These ratios are favorable, indicating a solid financial buffer supporting the dividends. The firm maintains a prudent dividend policy without compromising potential growth opportunities.
Cashflow & Capital Efficiency
Evaluating cash flow and capital efficiency metrics is vital as they depict how well the company utilizes its assets to generate cash flows, a significant determinant for sustained dividends. Principal Financial Group exhibits a strong balance between generating free cash flow and capital deployment.
| Year | 2023 | 2024 | 2025 |
|---|---|---|---|
| Free Cash Flow Yield | 19.84% | 25.89% | 22.29% |
| Earnings Yield | 3.35% | 8.97% | 5.95% |
| CAPEX to Operating Cash Flow | 2.69% | 1.49% | 2.16% |
| Stock-based Compensation to Revenue | 0.73% | -0.67% | 0% |
| Free Cash Flow / Operating Cash Flow Ratio | 97.31% | 98.50% | 97.84% |
The company's stability in cash flows and returns suggests a robust basis for sustaining its dividend policy and operational efficiency in managing capital.
Balance Sheet & Leverage Analysis
Analyzing Principal Financial Group's balance sheet and leverage ratios allows investors to assess the company's financial health and risk exposure. Low debt metrics reflect a conservative approach to financing, aligning well with the maintained dividend policy.
| Year | 2023 | 2024 | 2025 |
|---|---|---|---|
| Debt-to-Equity | 36.57% | 37.05% | 33.27% |
| Debt-to-Assets | 1.31% | 1.31% | 1.16% |
| Debt-to-Capital | 26.77% | 27.04% | 24.97% |
| Net Debt to EBITDA | -70.76% | -4.84% | -28.57% |
| Current Ratio | 57.70 | 52.50 | 30.39 |
| Quick Ratio | 57.70 | 52.50 | 30.39 |
| Financial Leverage | 27.94 | 28.29 | 28.73 |
Financial metrics demonstrate a conservative capital structure, maintaining a balance between growth and risk, supporting continued dividend reliability.
Fundamental Strength & Profitability
Profitability metrics illustrate the company's efficiency in generating returns on shareholders' equity, assets, and capital. Principal Financial Group shows solid profitability ratios that lend confidence in its dividend sustainability and growth potential.
| Year | 2023 | 2024 | 2025 |
|---|---|---|---|
| Return on Equity | 5.71% | 14.17% | 9.97% |
| Return on Assets | 0.20% | 0.50% | 0.35% |
| Margins: Net | 4.56% | 9.74% | 7.58% |
| EBIT | 5.41% | 11.72% | 9.08% |
| EBITDA | 7.40% | 13.31% | 10.68% |
| Gross | 43.17% | 45.59% | 45.19% |
| R&D to Revenue | 0.00% | 0.00% | 0.00% |
Fundamentals indicate strong operational performance and a durable competitive advantage, providing a stable foundation for ongoing dividend payments.
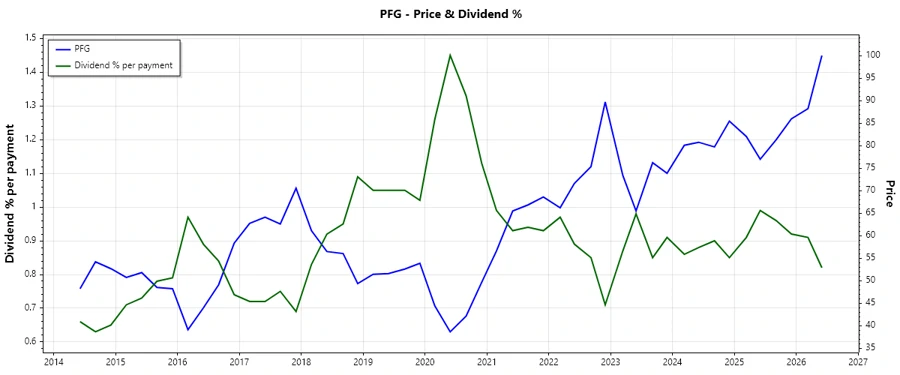
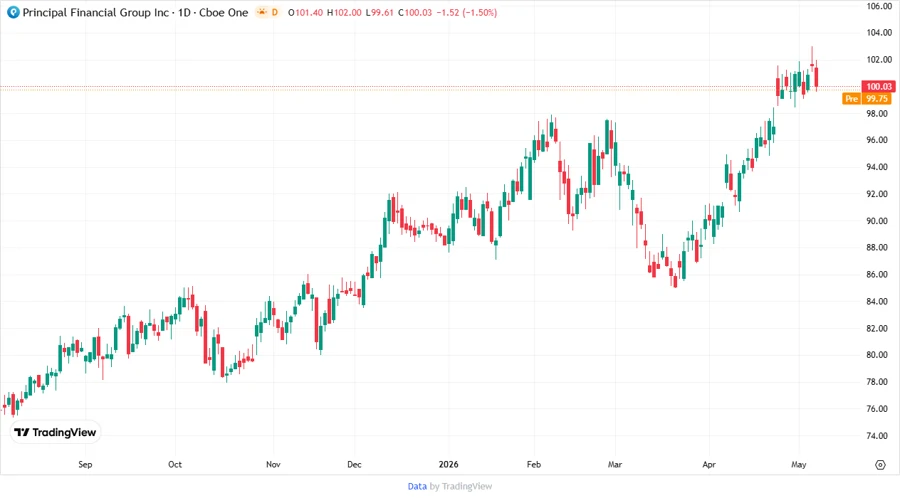
Price Development
✅ Dividend Scoring System
| Category | Score | Score Bar |
|---|---|---|
| Dividend yield | 4 | |
| Dividend Stability | 5 | |
| Dividend growth | 3 | |
| Payout ratio | 4 | |
| Financial stability | 4 | |
| Dividend continuity | 5 | |
| Cashflow Coverage | 4 | |
| Balance Sheet Quality | 4 |
Overall Score: 33/40
Rating
Given the consistent dividend history, modest growth rates, and sound financial structure, Principal Financial Group, Inc. offers a compelling case for income-focused investors. While the dividend yield is attractive, the slight variations in recent payouts should be monitored closely. Nevertheless, the robust cash flows and balanced payout strategies indicate that the company remains a viable and reliable choice for dividend sustainability with potential for moderate growth.
Smart Data Insight
Master the Perfect Entry & Exit for this Stock
Don't leave your profits to chance. Historically, this stock follows specific seasonal patterns that institutional traders use to maximize returns.
- ✅ Identify the "Golden Buying Window"
- ✅ Avoid high-risk correction cycles
- ✅ Backtested data from the last 20+ years