December 01, 2025 a 12:46 pm

PFG: Dividend Analysis - Principal Financial Group, Inc.
The Principal Financial Group, Inc. (PFG) presents a solid dividend profile with a respectful history in dividend payments and a forward-looking focus on sustainable growth. The company's current dividend yield of 3.63% surpasses the industry average, promoting investor confidence. With 24 consecutive years of dividend payments and a controlled payout ratio, PFG displays stability and commitment to shareholders. However, the recent growth figures suggest cautious optimism, reflecting moderate expansion in its dividend policies.
📊 Overview
PFG operates in the Financial Services sector, excelling in distributing sustainable dividends with a 3.63% yield.
| Category | Details |
|---|---|
| Sector | Financial Services |
| Dividend yield | 3.63% |
| Current dividend per share | 2.91 USD |
| Dividend history | 24 years |
| Last cut or suspension | 2008 |
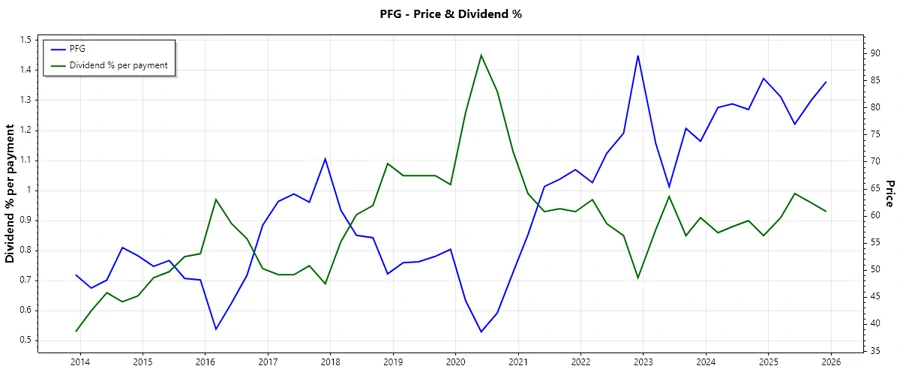
🗣️ Dividend History
PFG boasts a robust dividend history, showcasing 24 years of continuous dividend issuance. A noteworthy element for dividend investors, the consistency in payments underlines the firm's solid financial health. Its last dividend cut, recorded in 2008, speaks volumes about its resilience through economic cycles.
| Year | Dividend per Share (USD) |
|---|---|
| 2025 | 3.08 |
| 2024 | 2.85 |
| 2023 | 2.60 |
| 2022 | 2.56 |
| 2021 | 2.44 |
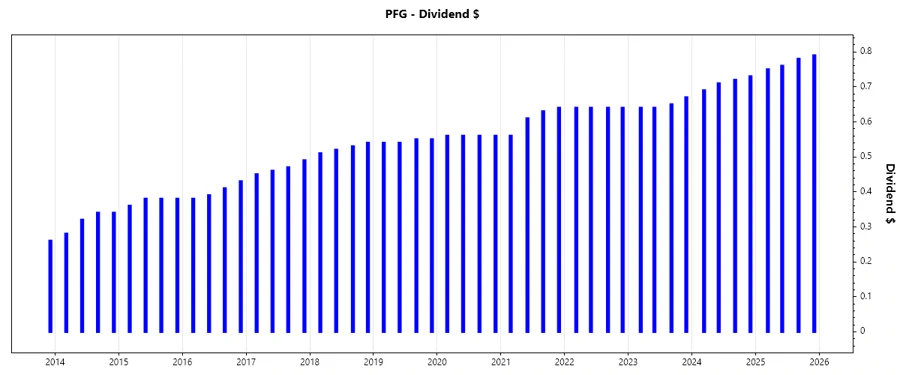
📈 Dividend Growth
The dividend growth metrics for PFG are encouraging, reflecting disciplined financial management. Dividends have grown by 5.31% over the last three years and 5.51% over the last five years, suggesting a moderate but steady growth trajectory.
| Time | Growth |
|---|---|
| 3 years | 5.31% |
| 5 years | 5.51% |
The average dividend growth is 5.51% over 5 years. This shows moderate but steady dividend growth.
✅ Payout Ratio
The payout ratio is a critical metric, reflecting the proportion of earnings distributed as dividends. PFG's EPS-based payout ratio stands at 41.45%, well within a sustainable range, ensuring room for reinvestment in growth. Similarly, the Free Cash Flow (FCF) payout ratio of 15.22% further corroborates PFG's efficient capital allocation.
| Key figure | Ratio |
|---|---|
| EPS-based | 41.45% |
| Free cash flow-based | 15.22% |
The EPS and FCF payout ratios indicate a healthy dividend coverage, enabling PFG to maintain a balance between rewarding shareholders and preserving capital for strategic initiatives.
⚖️ Cashflow & Capital Efficiency
PFG's cash flow generation and capital efficiency ratios reveal important insights into its operational health and investment capabilities. A Free Cash Flow Yield of 22.55% and Earnings Yield of 8.28% highlight its strong capacity for generating cash relative to its market valuation, supporting future dividend payouts.
| Metric | 2024 | 2023 | 2022 |
|---|---|---|---|
| Free Cash Flow Yield | 25.89% | 19.84% | 14.51% |
| Earnings Yield | 8.97% | 3.35% | 22.57% |
| CAPEX to Operating Cash Flow | 1.68% | 2.69% | 3.67% |
| Stock-based Compensation to Revenue | 0.67% | 0.73% | 0.52% |
| Free Cash Flow / Operating Cash Flow Ratio | 98.51% | 97.31% | 96.33% |
PFG exhibits robust cash flow stability and capital efficiency, indicating optimal resource utilization and promising sustainability in dividend payouts.
💼 Balance Sheet & Leverage Analysis
An examination of PFG's balance sheet reveals its strategic financial positioning. The Debt-to-Equity Ratio of 0.37 and Debt-to-Assets Ratio of 0.013 imply prudent debt management.
| Metric | 2024 | 2023 | 2022 |
|---|---|---|---|
| Debt-to-Equity | 0.37 | 0.37 | 0.41 |
| Debt-to-Assets | 0.013 | 0.013 | 0.013 |
| Debt-to-Capital | 0.27 | 0.27 | 0.29 |
| Net Debt to EBITDA | -0.05 | -0.71 | -0.12 |
| Current Ratio | 1.64 | 372.53 | 0.53 |
| Quick Ratio | 1.64 | 1162.98 | 5.14 |
These ratios reflect sound financial management, showcasing PFG's capability to efficiently handle its leverage and ensure long-term financial stability.
📈 Fundamental Strength & Profitability
PFG's profitability ratios underscore its strong financial foundation and its potential to generate consistent returns.
| Metric | 2024 | 2023 | 2022 |
|---|---|---|---|
| Return on Equity | 14.17% | 5.71% | 47.56% |
| Return on Assets | 0.50% | 0.20% | 1.57% |
| Net Margin | 9.74% | 4.56% | 27.13% |
| EBIT Margin | 11.72% | 5.41% | 34.14% |
| EBITDA Margin | 13.31% | 7.40% | 35.83% |
| Gross Margin | 45.59% | 43.17% | 62.98% |
| R&D to Revenue | 0.00% | 0.00% | 0.00% |
The profitability metrics are indicative of strong operational efficacy, underpinning PFG's ability to yield significant returns and uphold its dividend distributions sustainably.
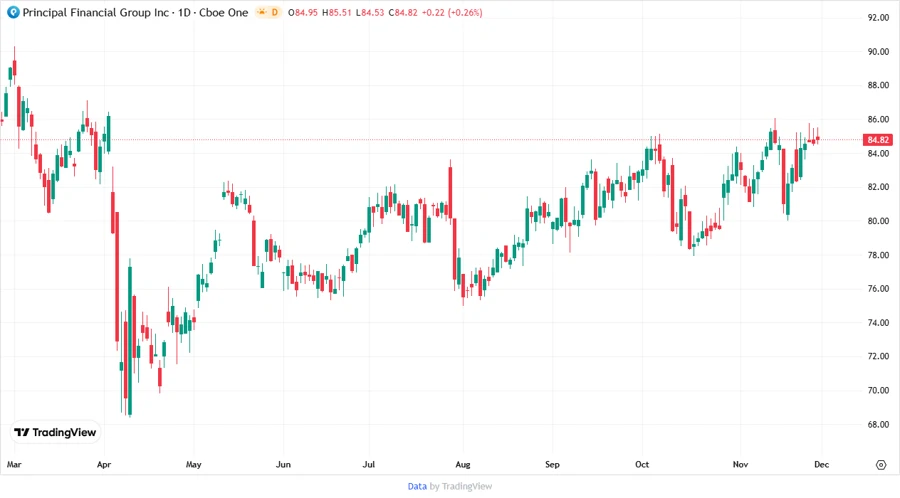
📉 Price Development
🔍 Dividend Scoring System
| Criterion | Score (1-5) | Rating |
|---|---|---|
| Dividend Yield | 4 | |
| Dividend Stability | 5 | |
| Dividend Growth | 3 | |
| Payout Ratio | 4 | |
| Financial Stability | 5 | |
| Dividend Continuity | 5 | |
| Cashflow Coverage | 4 | |
| Balance Sheet Quality | 4 |
Total Score: 34/40
⭐ Rating
Overall, Principal Financial Group, Inc. (PFG) maintains a robust position within the financial services sector, driven by a commendable dividend history and strategic financial stability. With a total score of 34/40 from our dividend scoring system, PFG presents a compelling investment proposition for income-focused investors. It's poised to deliver consistent returns, supported by efficient capital management and substantial profitability metrics. Investors are advised to consider PFG as a reliable long-term stake in dividend growth and stability.