November 11, 2025 a 12:46 pm

PFG: Dividend Analysis - Principal Financial Group, Inc.
Principal Financial Group, Inc. (PFG) presents a compelling dividend profile with a consistent history of payments and a promising yield. Over the years, PFG has demonstrated a commitment to rewarding shareholders, even in challenging financial climates. The company's dividend yield stands at an attractive level, accompanied by a solid dividend growth trajectory, indicating a robust financial foundation.
📊 Overview
Principal Financial Group, Inc. operates within the insurance sector, providing a stability-oriented investment approach. The company's current dividend yield is 3.69%, with a dividend per share of 2.91 USD, supported by 24 years of dividend history. Remarkably, the last cut or suspension occurred in 2008, highlighting resilience through economic cycles.
| Criteria | Details |
|---|---|
| Sector | Insurance |
| Dividend Yield | 3.69% |
| Current Dividend per Share | 2.91 USD |
| Dividend History | 24 years |
| Last Cut/Suspension | 2008 |
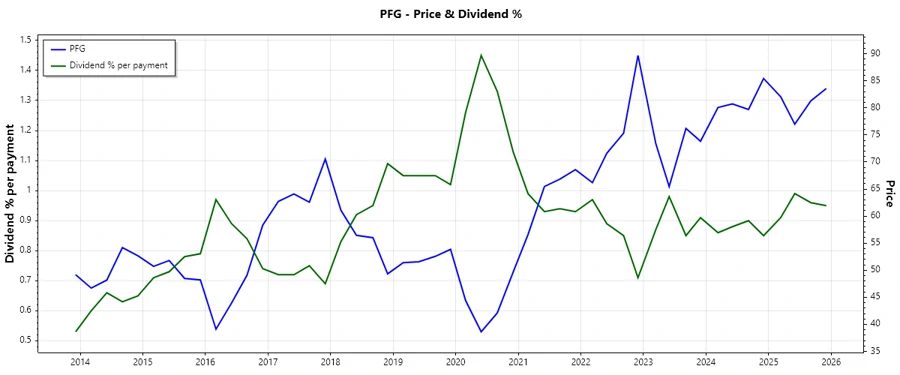
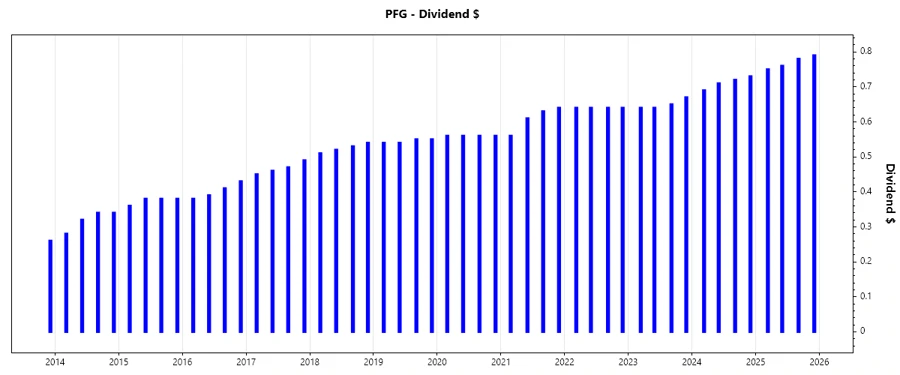
🗣️ Dividend History
A rich dividend history signifies the company's steadfast commitment to return capital to shareholders. It reflects reliability and potential for future payouts, a valuable trait for income-focused investors. Below is a responsive chart illustrating the trend over the years.
| Year | Dividend per Share (USD) |
|---|---|
| 2025 | 3.08 |
| 2024 | 2.85 |
| 2023 | 2.60 |
| 2022 | 2.56 |
| 2021 | 2.44 |
📈 Dividend Growth
Dividend growth is a crucial indicator of a company’s financial health and management’s confidence in future earnings. An increase in growth rates over time suggests an appreciating asset and income source for investors.
| Time | Growth |
|---|---|
| 3 years | 5.31% |
| 5 years | 5.51% |
The average dividend growth is 5.51% over 5 years. This shows moderate but steady dividend growth, an attractive aspect for long-term investors.
💼 Payout Ratio
The payout ratio measures the proportion of earnings a company pays to shareholders in dividends. A sustainable payout ratio is essential for dividend stability and future growth potential.
| Key Figure | Ratio |
|---|---|
| EPS-based | 41.45% |
| Free Cash Flow-based | 15.22% |
With an EPS-based payout ratio of 41.45% and a free cash flow-based ratio of 15.22%, the dividend appears well-covered by earnings and cash flows, ensuring sustainability and room for further increases.
💰 Cashflow & Capital Efficiency
A company’s cash flow and capital efficiency indicate how well it generates cash and utilizes its capital to grow. These metrics underline the firm's operational and strategic positioning.
| Metric | 2024 | 2023 | 2022 |
|---|---|---|---|
| Free Cash Flow Yield | 25.89% | 19.84% | 14.51% |
| Earnings Yield | 8.97% | 3.35% | 22.57% |
| CAPEX to Operating Cash Flow | 1.68% | 2.69% | 3.67% |
| Stock-based Compensation to Revenue | 0.67% | 0.73% | 0.52% |
| Free Cash Flow / Operating Cash Flow Ratio | 98.51% | 97.31% | 96.33% |
The cash flow metrics demonstrate solid cash generation capability, with a focus on capital efficiency ensuring robust financial health and potential for continued dividend growth.
📉 Balance Sheet & Leverage Analysis
A strong balance sheet with moderate leverage is a foundational element of financial security and long-term stability. The analysis reveals critical insights into the company’s financial risk profile.
| Metric | 2024 | 2023 | 2022 |
|---|---|---|---|
| Debt-to-Equity | 37.05% | 36.57% | 40.77% |
| Debt-to-Assets | 1.31% | 1.31% | 1.35% |
| Debt-to-Capital | 27.04% | 26.78% | 28.96% |
| Net Debt to EBITDA | -0.05 | -0.71 | -0.12 |
| Current Ratio | ∞ | 372.53 | 0.53 |
| Quick Ratio | 1.64 | 1162.98 | 5.14 |
| Financial Leverage | 28.29 | 27.94 | 30.30 |
The leverage metrics suggest a cautious approach to borrowing, supporting a solid financial framework that positions the company well for market fluctuations.
🏦 Fundamental Strength & Profitability
Evaluating fundamental strength and profitability provides insight into a company's operational excellence and growth potential in generating returns.
| Metric | 2024 | 2023 | 2022 |
|---|---|---|---|
| Return on Equity | 14.17% | 5.71% | 47.56% |
| Return on Assets | 0.50% | 0.20% | 1.57% |
| Net Margin | 9.74% | 4.56% | 27.13% |
| EBIT Margin | 11.72% | 5.41% | 34.14% |
| EBITDA Margin | 13.31% | 7.40% | 35.83% |
| Gross Margin | 45.59% | 43.17% | 62.98% |
The company exhibits strong profitability margins, indicating effective management and operational efficiency in capturing and retaining market share.
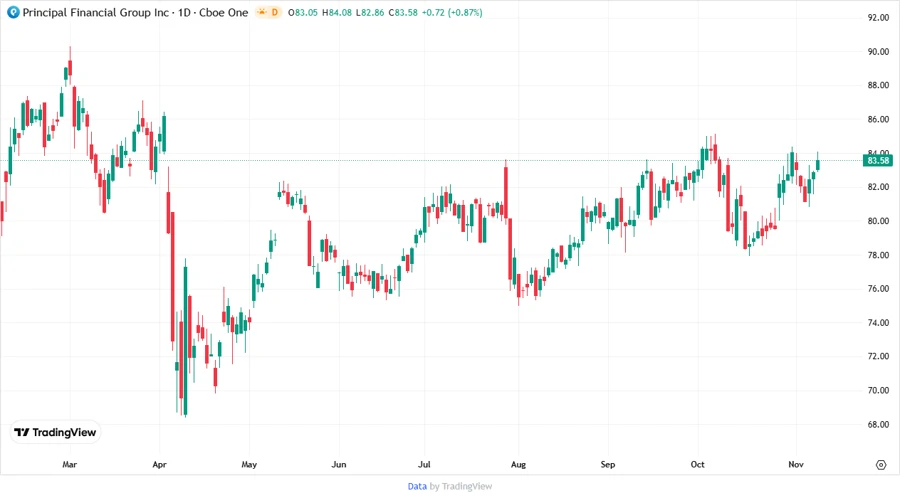
📉 Price Development
✅ Dividend Scoring System
| Criteria | Score | Score Bar |
|---|---|---|
| Dividend Yield | 4 | |
| Dividend Stability | 4 | |
| Dividend Growth | 3 | |
| Payout Ratio | 5 | |
| Financial Stability | 4 | |
| Dividend Continuity | 4 | |
| Cashflow Coverage | 5 | |
| Balance Sheet Quality | 4 |
Total Score: 33/40
📈 Rating
Principal Financial Group, Inc. emerges as a robust dividend-paying entity with a commendable dividend history, stability, and moderate growth prospects. The comprehensive financial analysis underscores a sound financial structure supportive of continued shareholder rewards. Given its balance of yield, growth, and stability, Principal Financial Group, Inc. is a recommended investment for dividend-seeking portfolios, offering a harmonious blend of income and growth potential.
Smart Data Insight
Master the Perfect Entry & Exit for this Stock
Don't leave your profits to chance. Historically, this stock follows specific seasonal patterns that institutional traders use to maximize returns.
- ✅ Identify the "Golden Buying Window"
- ✅ Avoid high-risk correction cycles
- ✅ Backtested data from the last 20+ years