
June 27, 2026 a 01:15 pm
PFE: Trend and Support & Resistance Analysis - Pfizer Inc.
Pfizer Inc., a leader in the biopharmaceutical industry, has exhibited varying trends. Analysis of recent data indicates the presence of distinct support and resistance zones, suggesting both opportunities and challenges for potential investors. The technical trend could offer insights for strategic decision-making.
Trend Analysis
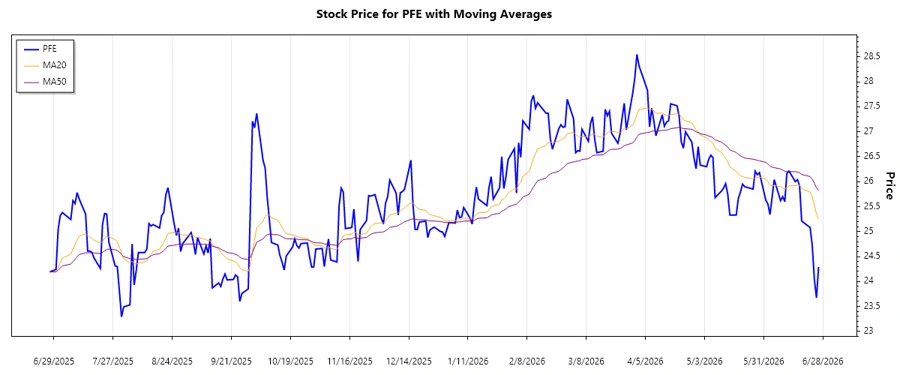
Based on the analysis of the historical closing data for Pfizer Inc., we calculate the EMA20 and EMA50 moving averages. The trend interpretation is as follows:
| Date | Closing Price | Trend |
|---|---|---|
| 2026-06-26 | 24.29 | ▼ Abwärtstrend |
| 2026-06-25 | 23.67 | ▼ Abwärtstrend |
| 2026-06-24 | 24.04 | ▼ Abwärtstrend |
| 2026-06-23 | 24.72 | ▼ Abwärtstrend |
| 2026-06-22 | 25.08 | ▼ Abwärtstrend |
| 2026-06-18 | 25.21 | ▼ Abwärtstrend |
| 2026-06-17 | 25.92 | ▼ Abwärtstrend |
The EMA20 is below the EMA50, suggesting a persistent downward trend. This indicates bearish sentiment, potentially prompting caution among investors.
Support and Resistance
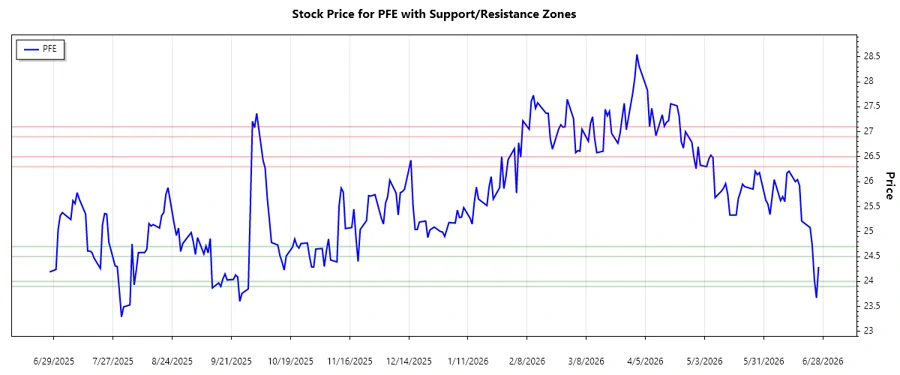
Using historical closing prices, we have identified key support and resistance zones for Pfizer Inc.
| Zone Type | From | To |
|---|---|---|
| Resistance Zone 1 | ▲ 26.30 | ▲ 26.50 |
| Resistance Zone 2 | ▲ 26.90 | ▲ 27.10 |
| Support Zone 1 | ▼ 24.50 | ▼ 24.70 |
| Support Zone 2 | ▼ 23.90 | ▼ 24.00 |
The current price is approaching the lower support zone, reflecting potential buy signals if the price stabilizes within this region. A break below may signal further declines, while maintaining support may suggest consolidation.
Conclusion
Pfizer Inc. faces a challenging period with a prevailing downward trend, suggesting potential caution among investors. Identifying support and resistance zones provides insights for entry or exit points, with current prices flirting near key support levels. Monitoring for a break or rebound at these levels is crucial for determining potential market movements. Given Pfizer’s solid product line and strategic partnerships, market corrections might provide buying opportunities, but risks persist amid broader market trends. Analysts should weigh these factors before making investment decisions.
Smart Data Insight
Master the Perfect Entry & Exit for this Stock
Don't leave your profits to chance. Historically, this stock follows specific seasonal patterns that institutional traders use to maximize returns.
- ✅ Identify the "Golden Buying Window"
- ✅ Avoid high-risk correction cycles
- ✅ Backtested data from the last 20+ years