August 20, 2025 a 04:03 am

PFE: Trend and Support & Resistance Analysis - Pfizer Inc.
Pfizer Inc. has shown a wide array of therapeutic products and collaborations with major pharma companies. The stock performance indicates a mixed trend over the last months, with recent fluctuations affecting investors' sentiment. The technical indicators suggest a potential short-term opportunity for trading, though investors should be wary of external market pressures. The trend analysis highlights possible areas of support and resistance, providing insights into the stock's price behavior.
Trend Analysis
| Date | Closing Price | Trend |
|---|---|---|
| 2025-08-19 | $25.32 | ▲ Upward |
| 2025-08-18 | $25.07 | ▲ Upward |
| 2025-08-15 | $25.14 | ▲ Upward |
| 2025-08-14 | $25.11 | ▲ Upward |
| 2025-08-13 | $25.16 | ▲ Upward |
| 2025-08-12 | $24.65 | ▼ Downward |
| 2025-08-11 | $24.58 | ▼ Downward |
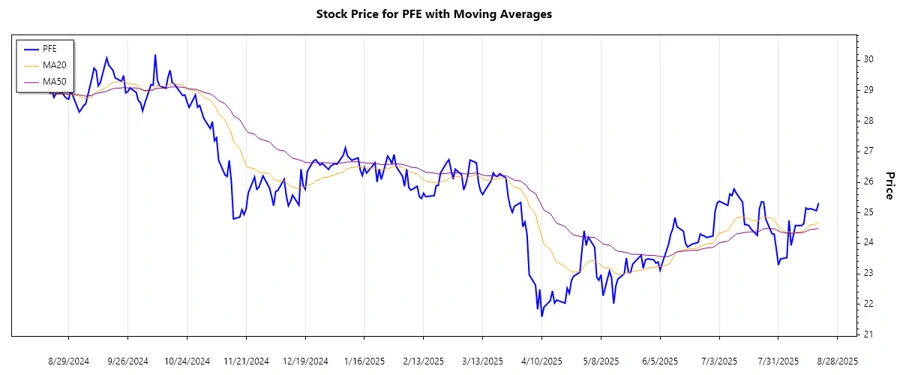
The 20-day EMA is slightly higher than the 50-day EMA, indicating a short-term upward trend. However, due to recent volatility, this could shift quickly.
Support and Resistance
| Support | Resistance |
|---|---|
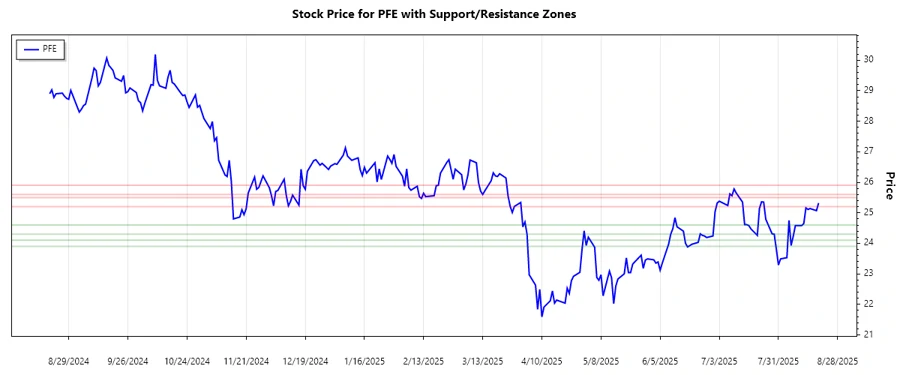
| ▼ $24.30 - $24.60 | ▲ $25.20 - $25.50 |
| ▼ $23.90 - $24.10 | ▲ $25.60 - $25.90 |
Currently, the stock is trading within the first support zone, which may provide a buying opportunity should it hold. If the price drops through this zone, the next support could be tested.
Conclusion
Pfizer Inc.'s stock is experiencing a modest upward trend, reinforced by the recent EMA crossovers. The stock's proximity to the identified support zones offers potential entry points or cautions for bearish movements. While Pfizer's strong product portfolio and collaborations foster a positive outlook, current market factors could lead to unexpected swings in stock performance. Analysts should remain vigilant for price movements near identified resistance levels. Risk management is essential given the volatile nature of the market environment.
Smart Data Insight
Master the Perfect Entry & Exit for this Stock
Don't leave your profits to chance. Historically, this stock follows specific seasonal patterns that institutional traders use to maximize returns.
- ✅ Identify the "Golden Buying Window"
- ✅ Avoid high-risk correction cycles
- ✅ Backtested data from the last 20+ years