
July 15, 2026 a 03:15 pm
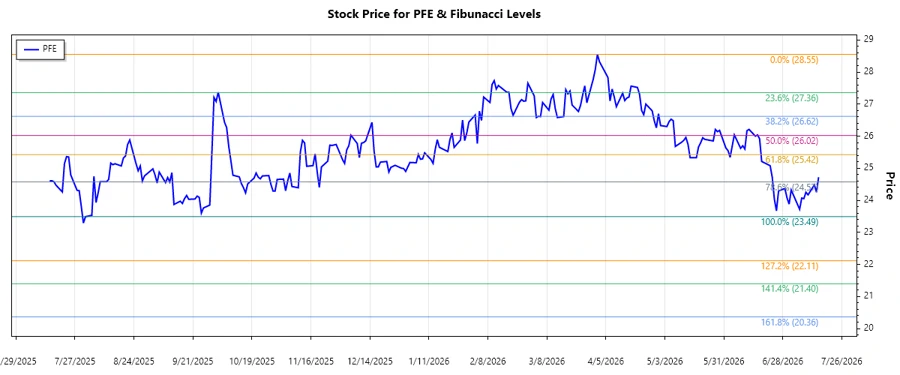
PFE: Fibonacci Analysis - Pfizer Inc.
Pfizer Inc. has shown resilience amid the fluctuating market conditions. The recent data indicates a strong recovery phase characterized by increasing investor confidence in its strategic initiatives and promising pipeline. This analysis will explore the significant price movements and retracement levels in Pfizer's stock, offering insights into potential price action and investment opportunities.
Fibonacci Analysis
| Attribute | Details |
|---|---|
| Trend Start Date | 2025-09-29 |
| Trend End Date | 2026-07-15 |
| High Point (Price and Date) | $28.55 on 2026-04-01 |
| Low Point (Price and Date) | $23.49 on 2025-08-01 |
| Fibonacci Levels |
|
| Current Price | $24.72 |
| Retracement Zone | 0.236 |
| Technical Interpretation | The current price suggests that Pfizer's stock might be consolidating near the 23.6% retracement level, indicating a potential support area. This could suggest a possible rebound if the price finds support here, presenting a buying opportunity. |
Conclusion
Pfizer Inc. exhibits a potential upward trajectory, with its current price hovering around key Fibonacci support levels. This indicates a promising technical setup for investors seeking long-term growth. However, the volatility inherent in the pharmaceutical industry and the impact of regulatory challenges must be considered. Strategic partnerships and product diversification may mitigate some market risks, yet a careful monitoring of the overall industry sentiment is crucial for informed decision-making. Overall, the technical indicators suggest a cautious yet optimistic outlook for Pfizer's stock.
Smart Data Insight
Master the Perfect Entry & Exit for this Stock
Don't leave your profits to chance. Historically, this stock follows specific seasonal patterns that institutional traders use to maximize returns.
- ✅ Identify the "Golden Buying Window"
- ✅ Avoid high-risk correction cycles
- ✅ Backtested data from the last 20+ years